| __timestamp | Corning Incorporated | Fortinet, Inc. |
|---|---|---|
| Wednesday, January 1, 2014 | 5663000000 | 231009000 |
| Thursday, January 1, 2015 | 5458000000 | 286777000 |
| Friday, January 1, 2016 | 5644000000 | 337837000 |
| Sunday, January 1, 2017 | 6084000000 | 385284000 |
| Monday, January 1, 2018 | 6829000000 | 450400000 |
| Tuesday, January 1, 2019 | 7468000000 | 505900000 |
| Wednesday, January 1, 2020 | 7772000000 | 570000000 |
| Friday, January 1, 2021 | 9019000000 | 783000000 |
| Saturday, January 1, 2022 | 9683000000 | 1084900000 |
| Sunday, January 1, 2023 | 8657000000 | 1237200000 |
| Monday, January 1, 2024 | 8842000000 | 1157600000 |
Infusing magic into the data realm
In the ever-evolving landscape of technology and manufacturing, Fortinet, Inc. and Corning Incorporated stand as titans in their respective fields. Over the past decade, from 2014 to 2023, these companies have showcased distinct trajectories in their cost of revenue. Corning, a leader in materials science, has seen its cost of revenue grow by approximately 53%, peaking in 2022. This reflects its expansive operations and innovation in glass and ceramics. Meanwhile, Fortinet, a cybersecurity powerhouse, has experienced a staggering 436% increase in its cost of revenue, highlighting its rapid growth and the increasing demand for cybersecurity solutions. By 2023, Fortinet's cost of revenue reached nearly 1.24 billion, a testament to its strategic investments and market expansion. This comparison not only underscores the dynamic nature of these industries but also offers insights into how each company navigates its unique challenges and opportunities.
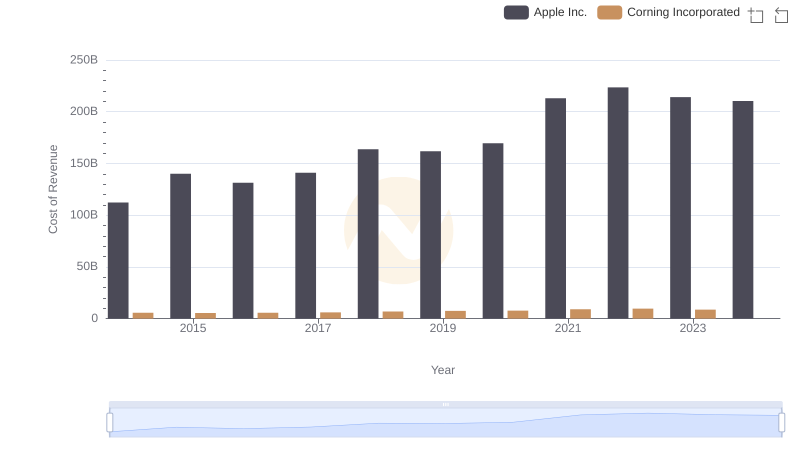
Cost Insights: Breaking Down Apple Inc. and Corning Incorporated's Expenses
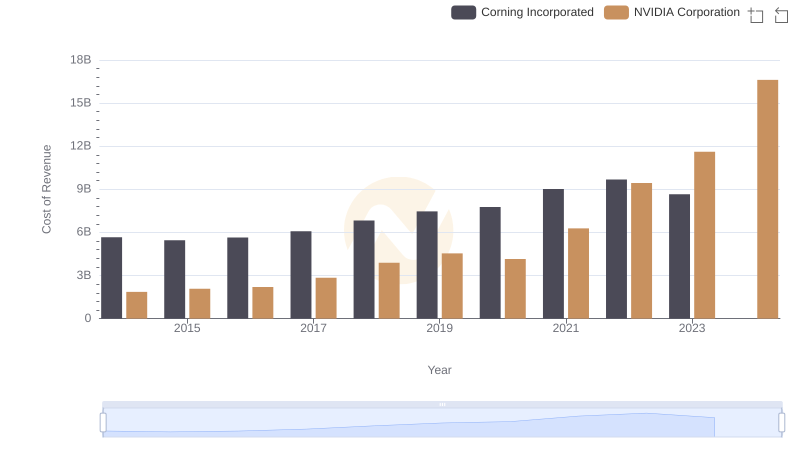
Cost of Revenue Comparison: NVIDIA Corporation vs Corning Incorporated
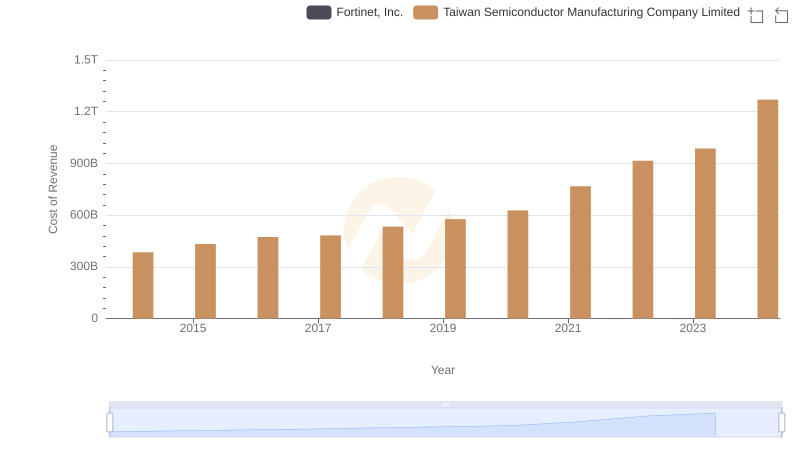
Cost Insights: Breaking Down Taiwan Semiconductor Manufacturing Company Limited and Fortinet, Inc.'s Expenses
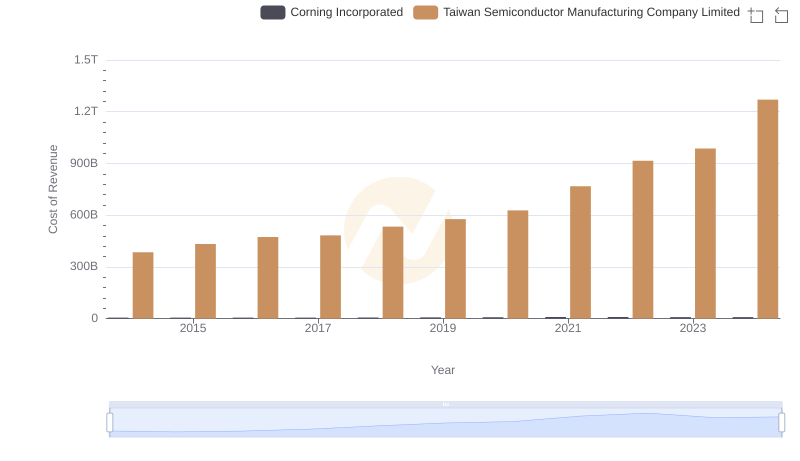
Cost of Revenue Trends: Taiwan Semiconductor Manufacturing Company Limited vs Corning Incorporated
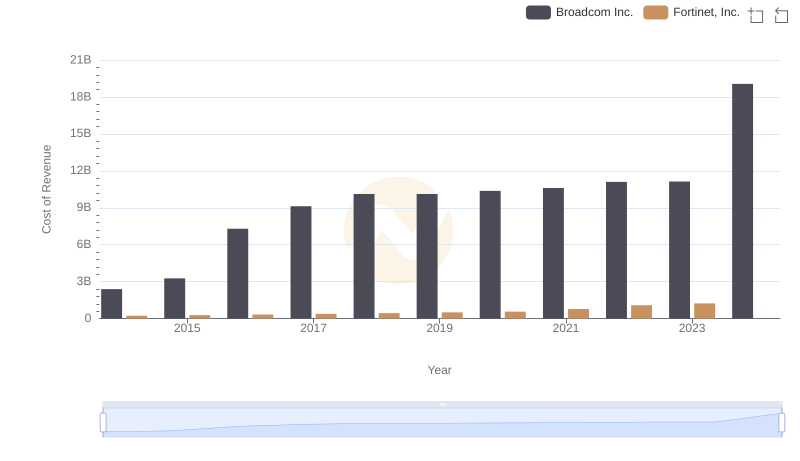
Cost of Revenue: Key Insights for Broadcom Inc. and Fortinet, Inc.
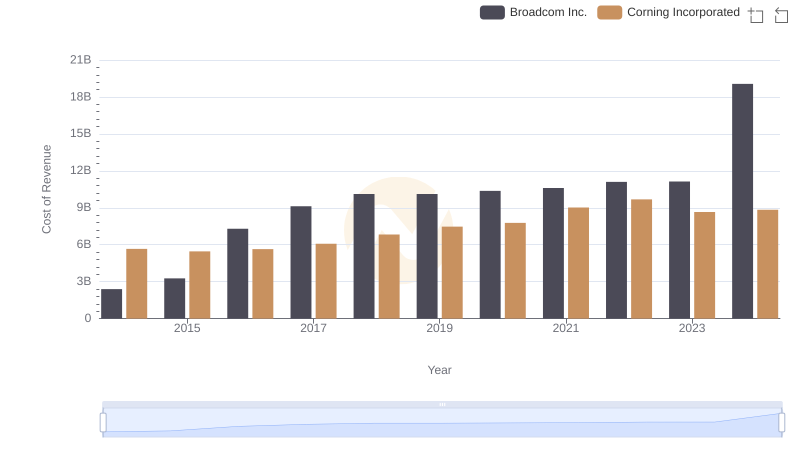
Cost Insights: Breaking Down Broadcom Inc. and Corning Incorporated's Expenses
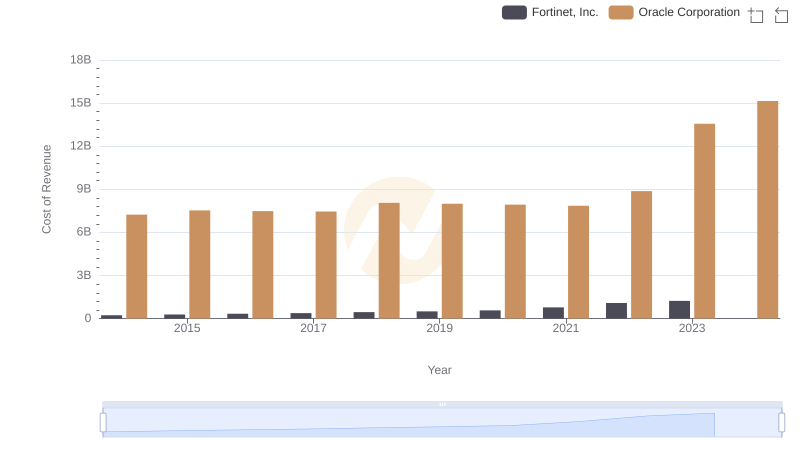
Cost of Revenue: Key Insights for Oracle Corporation and Fortinet, Inc.
Fortinet, Inc. vs Corning Incorporated: Examining Key Revenue Metrics
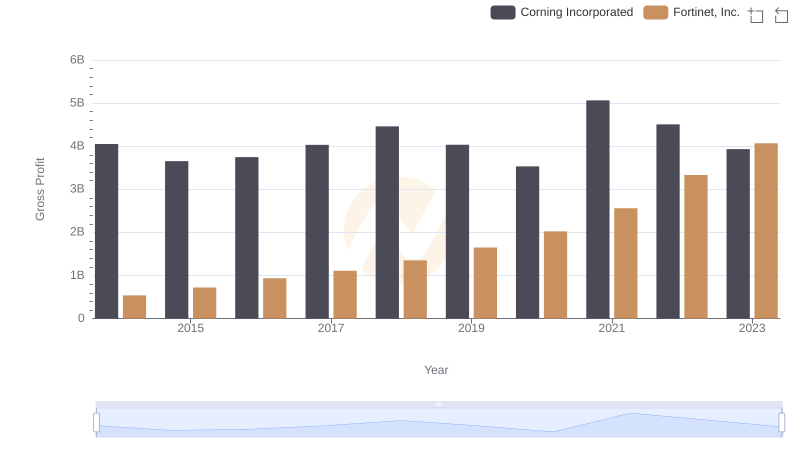
Gross Profit Trends Compared: Fortinet, Inc. vs Corning Incorporated
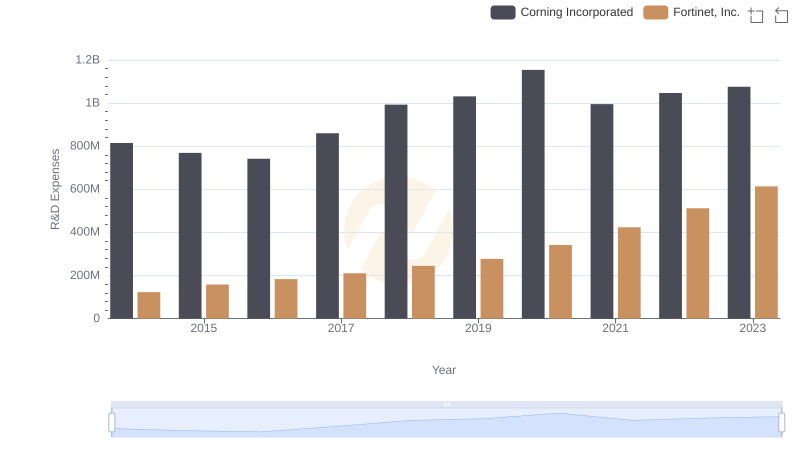
R&D Spending Showdown: Fortinet, Inc. vs Corning Incorporated
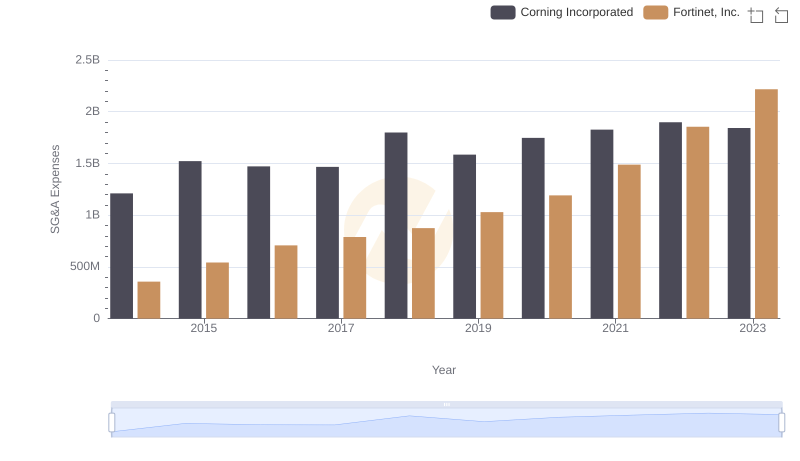
SG&A Efficiency Analysis: Comparing Fortinet, Inc. and Corning Incorporated
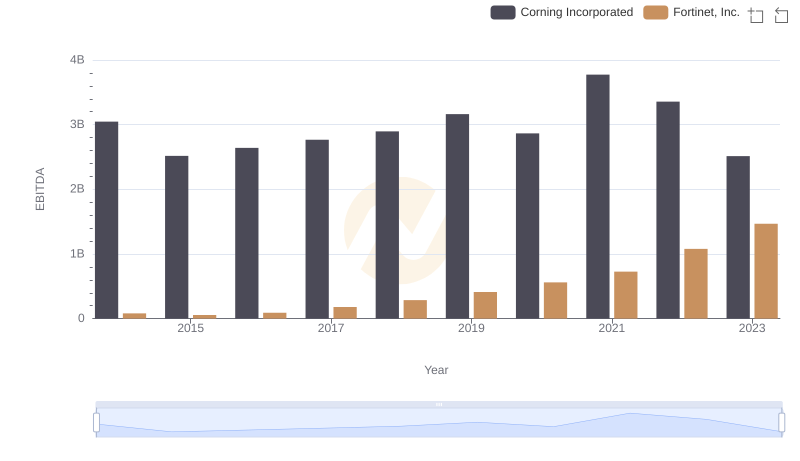
Comprehensive EBITDA Comparison: Fortinet, Inc. vs Corning Incorporated