| __timestamp | Corning Incorporated | Fortinet, Inc. |
|---|---|---|
| Wednesday, January 1, 2014 | 3046000000 | 81352000 |
| Thursday, January 1, 2015 | 2517000000 | 55766000 |
| Friday, January 1, 2016 | 2640000000 | 91668000 |
| Sunday, January 1, 2017 | 2766000000 | 179470000 |
| Monday, January 1, 2018 | 2897000000 | 286700000 |
| Tuesday, January 1, 2019 | 3163000000 | 412600000 |
| Wednesday, January 1, 2020 | 2865000000 | 560400000 |
| Friday, January 1, 2021 | 3774000000 | 727700000 |
| Saturday, January 1, 2022 | 3357000000 | 1077800000 |
| Sunday, January 1, 2023 | 2514000000 | 1468100000 |
| Monday, January 1, 2024 | 2492000000 | 1803400000 |
Unleashing the power of data
In the ever-evolving landscape of technology and manufacturing, Fortinet, Inc. and Corning Incorporated have carved distinct paths over the past decade. Fortinet, a leader in cybersecurity, has seen its EBITDA grow exponentially, from a modest $81 million in 2014 to a staggering $1.47 billion in 2023. This represents an impressive growth rate of over 1,700%, underscoring the increasing demand for cybersecurity solutions in a digital-first world.
Conversely, Corning, a stalwart in materials science, has experienced a more fluctuating journey. Despite a peak EBITDA of $3.77 billion in 2021, recent years have seen a decline, with 2023 figures dropping to $2.51 billion. This 33% decrease highlights the challenges faced by traditional manufacturing sectors amidst global economic shifts.
As we look to the future, these trends offer a compelling narrative of innovation versus tradition, with each company navigating its unique challenges and opportunities.
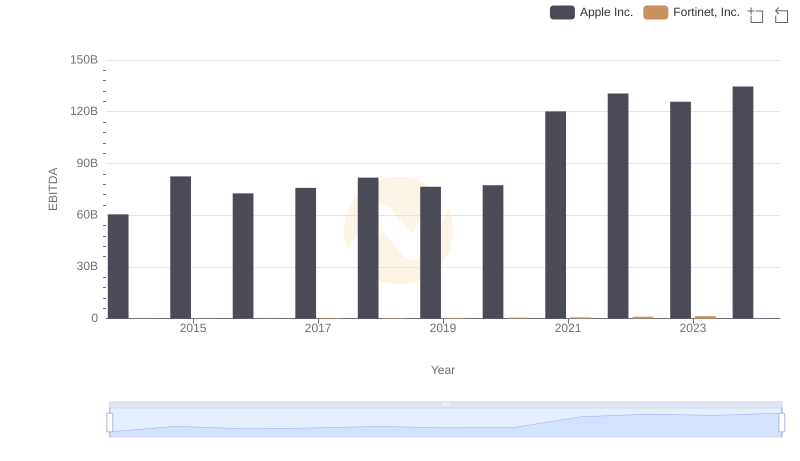
Professional EBITDA Benchmarking: Apple Inc. vs Fortinet, Inc.
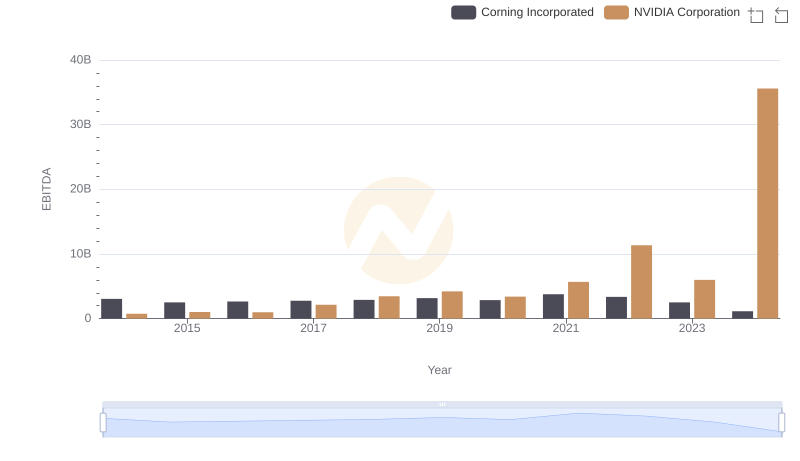
NVIDIA Corporation vs Corning Incorporated: In-Depth EBITDA Performance Comparison
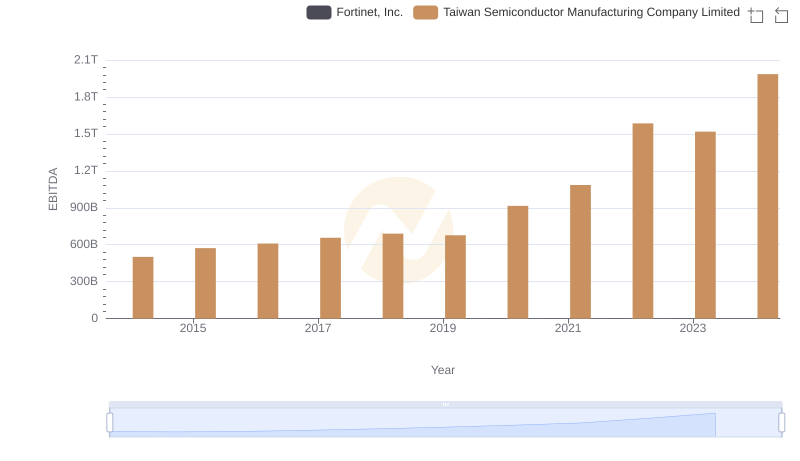
Professional EBITDA Benchmarking: Taiwan Semiconductor Manufacturing Company Limited vs Fortinet, Inc.
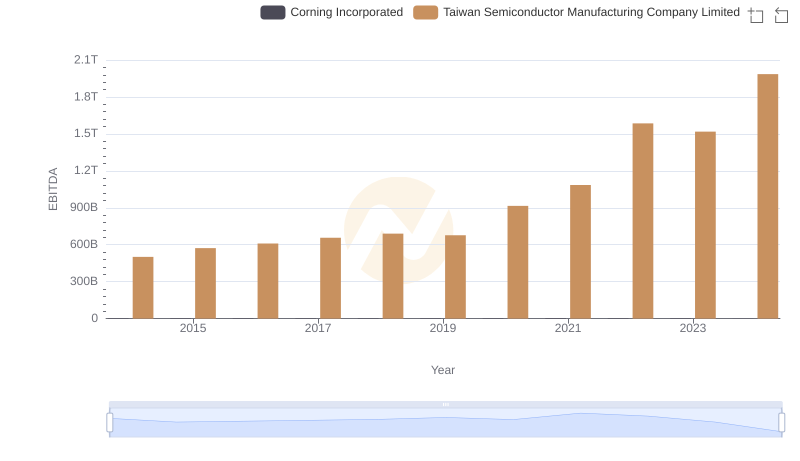
EBITDA Performance Review: Taiwan Semiconductor Manufacturing Company Limited vs Corning Incorporated
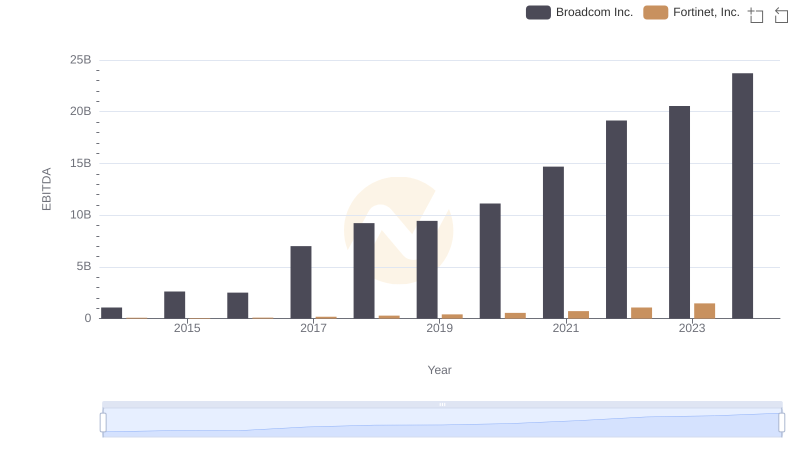
Comparative EBITDA Analysis: Broadcom Inc. vs Fortinet, Inc.
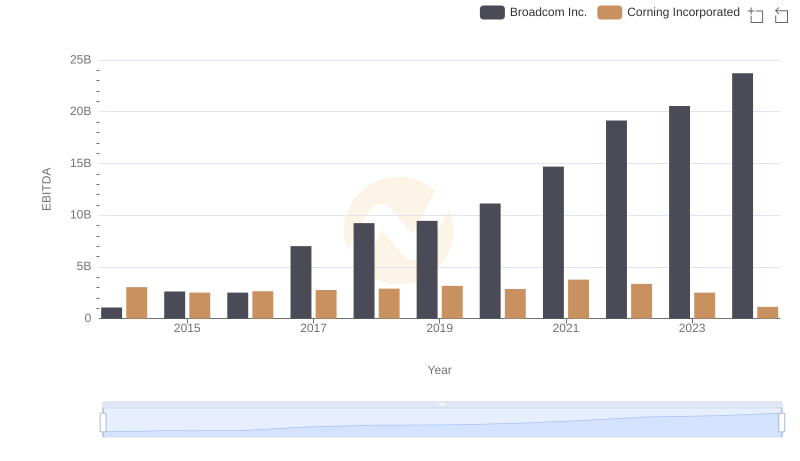
EBITDA Analysis: Evaluating Broadcom Inc. Against Corning Incorporated
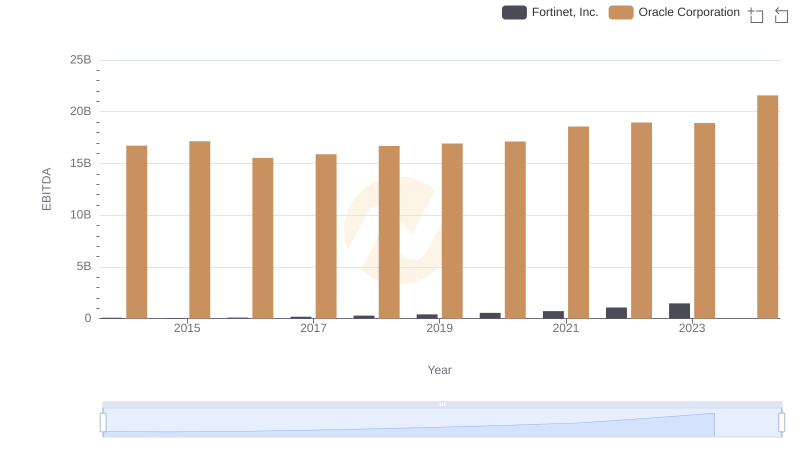
EBITDA Performance Review: Oracle Corporation vs Fortinet, Inc.
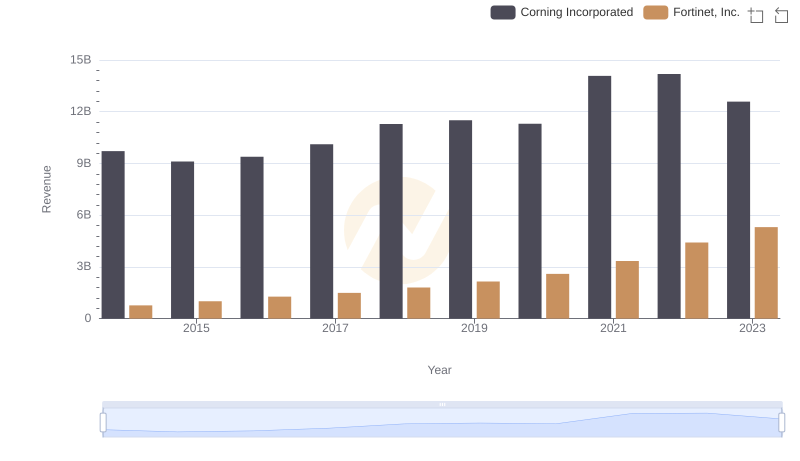
Fortinet, Inc. vs Corning Incorporated: Examining Key Revenue Metrics
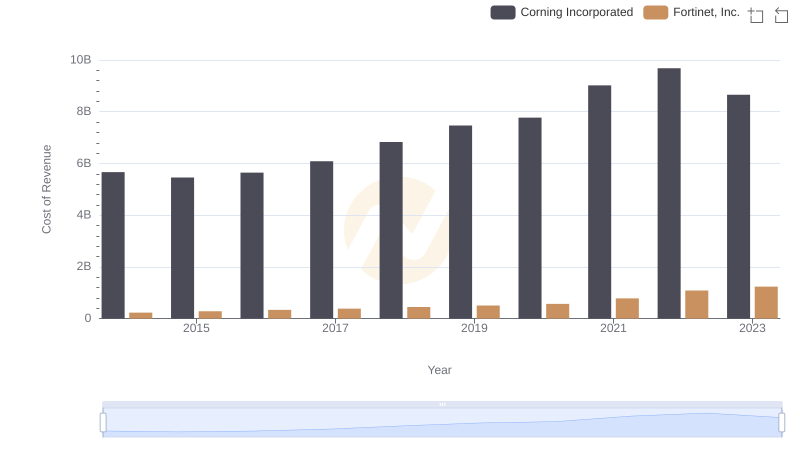
Cost of Revenue Comparison: Fortinet, Inc. vs Corning Incorporated
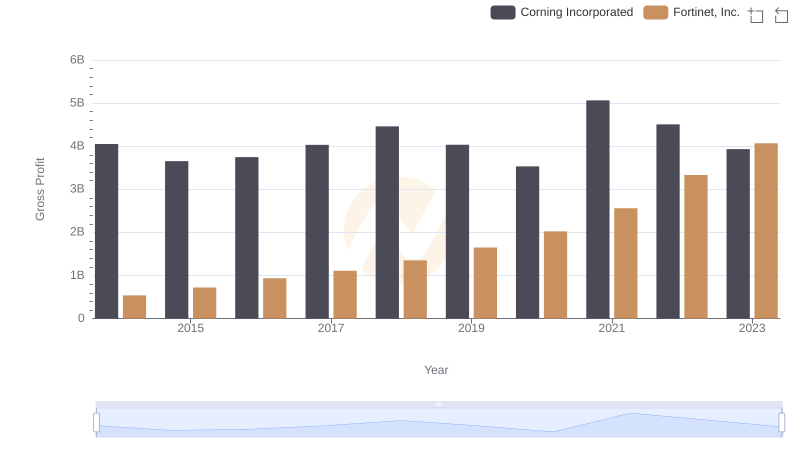
Gross Profit Trends Compared: Fortinet, Inc. vs Corning Incorporated
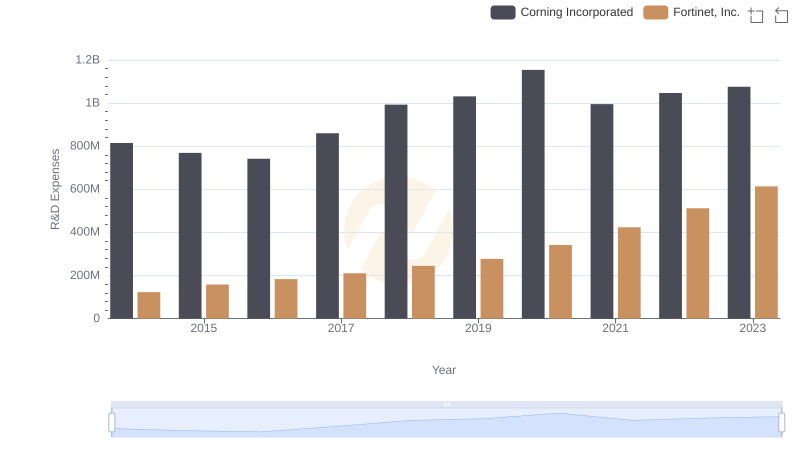
R&D Spending Showdown: Fortinet, Inc. vs Corning Incorporated
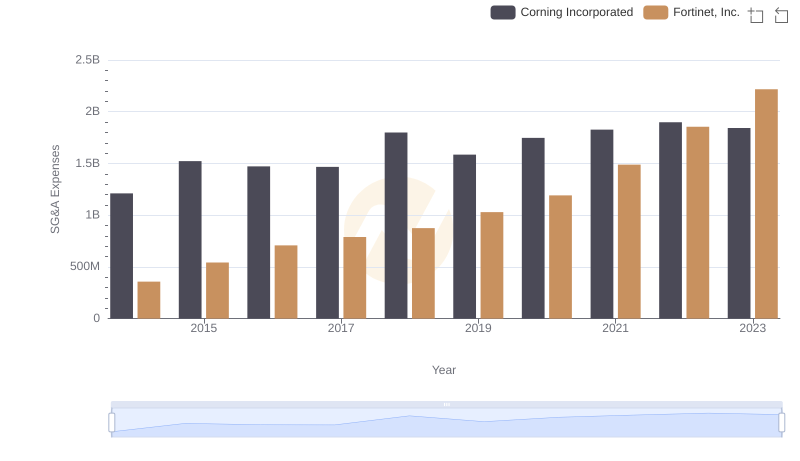
SG&A Efficiency Analysis: Comparing Fortinet, Inc. and Corning Incorporated