| __timestamp | ASE Technology Holding Co., Ltd. | Fortinet, Inc. |
|---|---|---|
| Wednesday, January 1, 2014 | 256591000000 | 770364000 |
| Thursday, January 1, 2015 | 283302000000 | 1009268000 |
| Friday, January 1, 2016 | 274884000000 | 1275443000 |
| Sunday, January 1, 2017 | 290441000000 | 1494930000 |
| Monday, January 1, 2018 | 371092000000 | 1801200000 |
| Tuesday, January 1, 2019 | 413182000000 | 2156200000 |
| Wednesday, January 1, 2020 | 476978000000 | 2594400000 |
| Friday, January 1, 2021 | 569997000000 | 3342200000 |
| Saturday, January 1, 2022 | 670873000000 | 4417400000 |
| Sunday, January 1, 2023 | 581914471000 | 5304800000 |
| Monday, January 1, 2024 | 595410063000 | 5955800000 |
Unlocking the unknown
In the ever-evolving landscape of technology, revenue growth is a key indicator of a company's success. Over the past decade, Fortinet, Inc. and ASE Technology Holding Co., Ltd. have showcased contrasting revenue trajectories. Fortinet, a leader in cybersecurity, has seen its revenue grow by an impressive 590% from 2014 to 2023, reflecting the increasing demand for digital security solutions. In contrast, ASE Technology, a titan in semiconductor manufacturing, experienced a more modest 127% growth over the same period.
Starting in 2014, ASE Technology's revenue was approximately 256 billion, while Fortinet's was just under 770 million. Fast forward to 2023, and Fortinet's revenue has surged to over 5.3 billion, while ASE Technology's revenue reached nearly 582 billion. This comparison highlights the dynamic nature of the tech industry, where innovation and market demand drive financial performance.
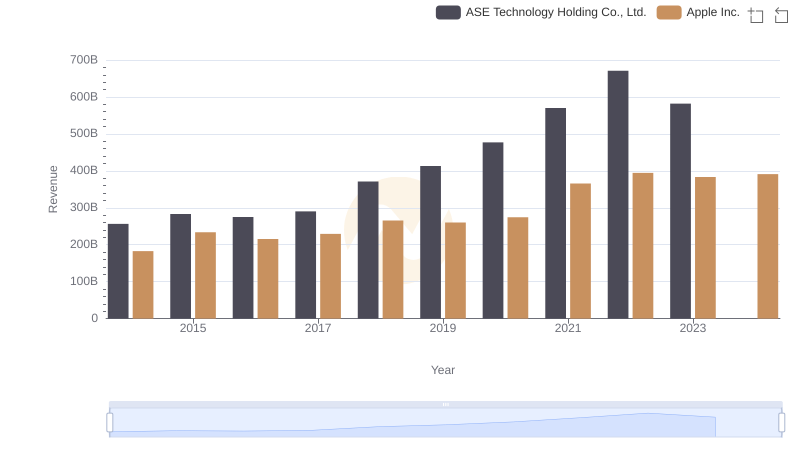
Apple Inc. or ASE Technology Holding Co., Ltd.: Who Leads in Yearly Revenue?
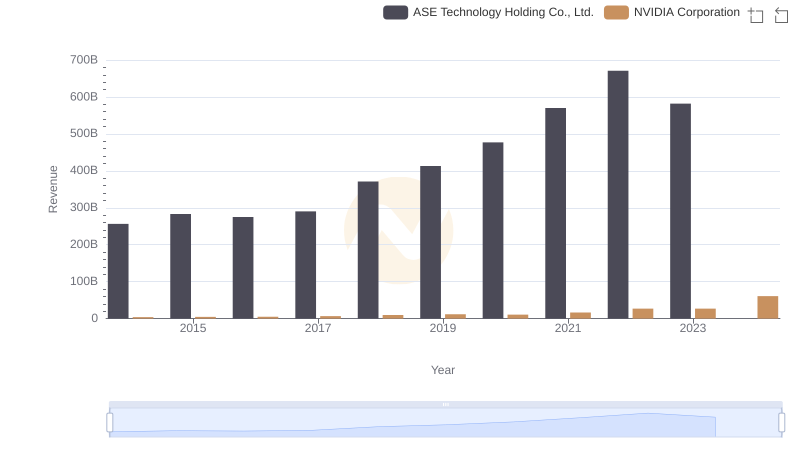
NVIDIA Corporation vs ASE Technology Holding Co., Ltd.: Annual Revenue Growth Compared
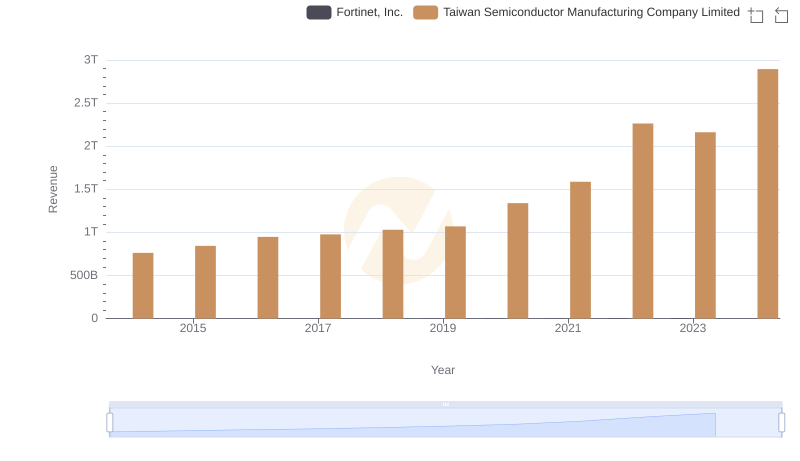
Revenue Showdown: Taiwan Semiconductor Manufacturing Company Limited vs Fortinet, Inc.
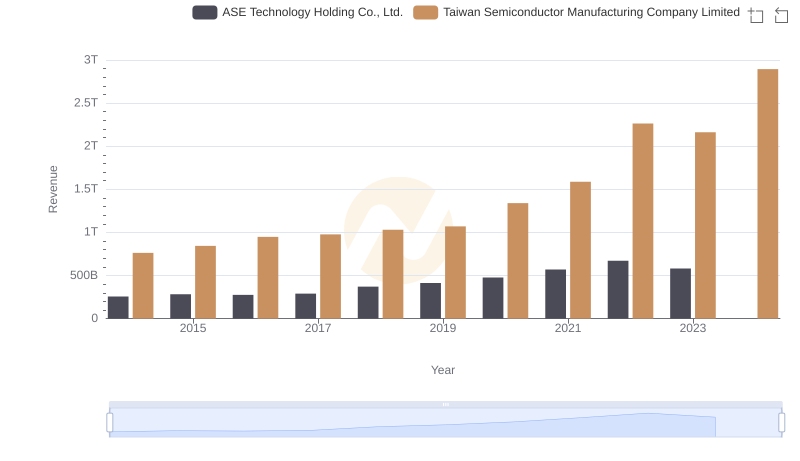
Taiwan Semiconductor Manufacturing Company Limited or ASE Technology Holding Co., Ltd.: Who Leads in Yearly Revenue?
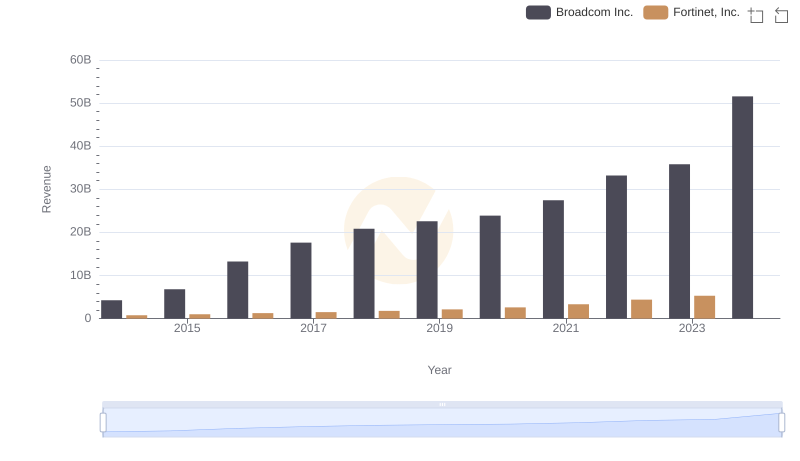
Revenue Showdown: Broadcom Inc. vs Fortinet, Inc.
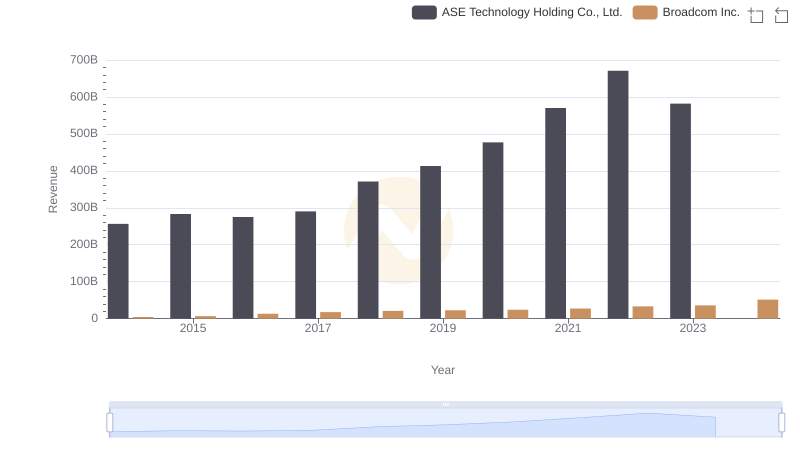
Broadcom Inc. and ASE Technology Holding Co., Ltd.: A Comprehensive Revenue Analysis
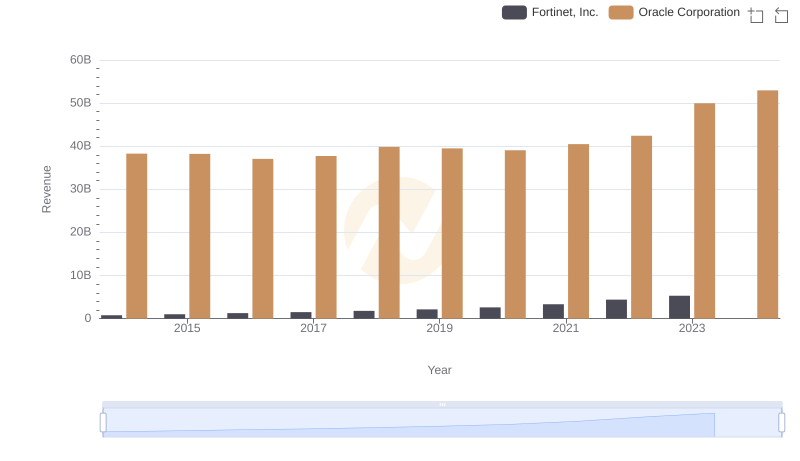
Oracle Corporation and Fortinet, Inc.: A Comprehensive Revenue Analysis
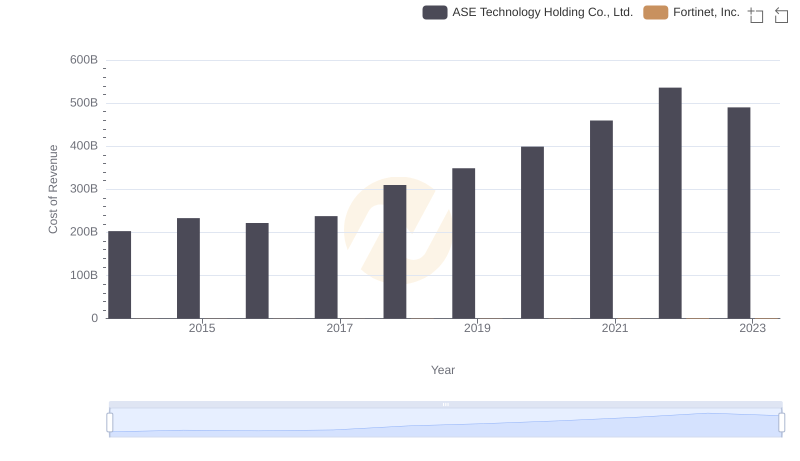
Cost of Revenue Comparison: Fortinet, Inc. vs ASE Technology Holding Co., Ltd.
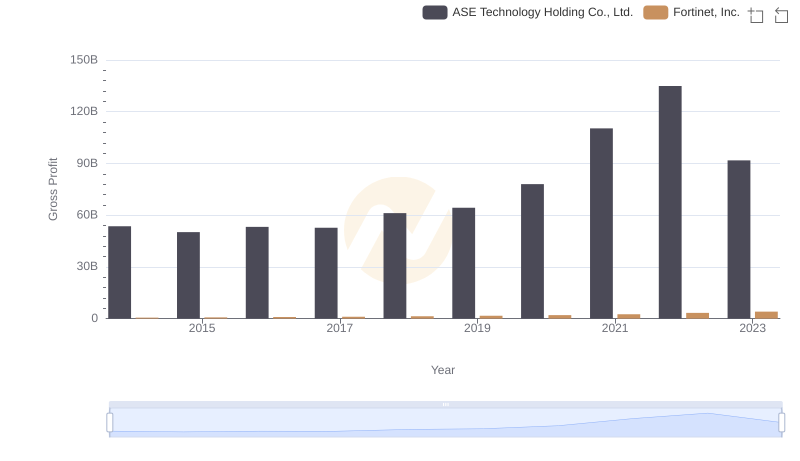
Key Insights on Gross Profit: Fortinet, Inc. vs ASE Technology Holding Co., Ltd.
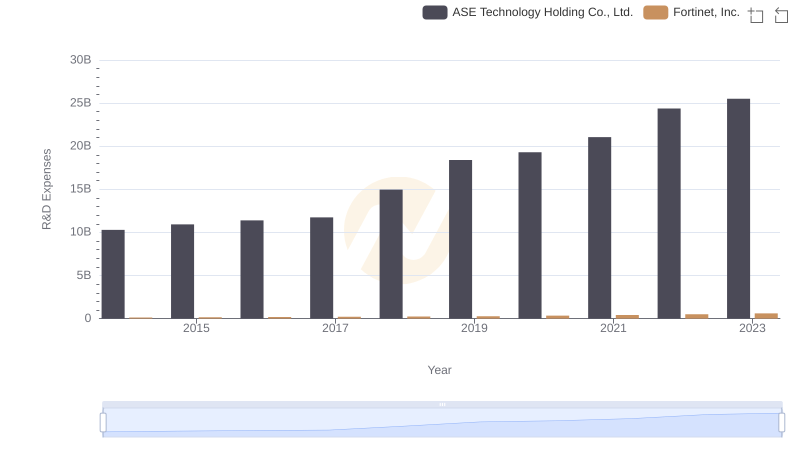
R&D Spending Showdown: Fortinet, Inc. vs ASE Technology Holding Co., Ltd.
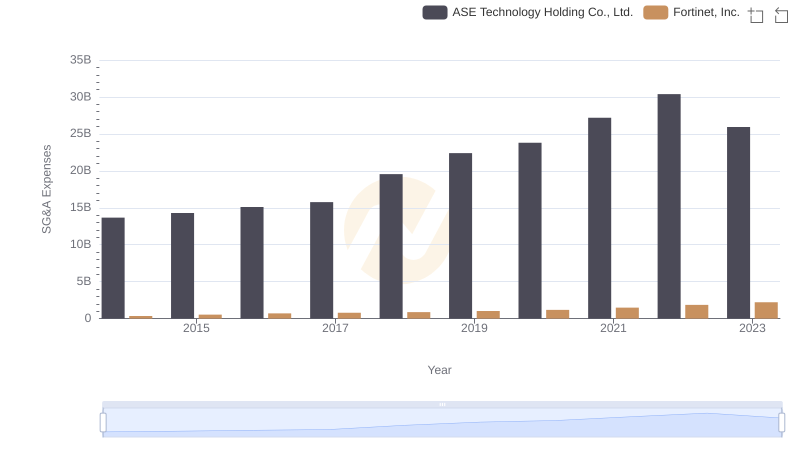
Fortinet, Inc. or ASE Technology Holding Co., Ltd.: Who Manages SG&A Costs Better?
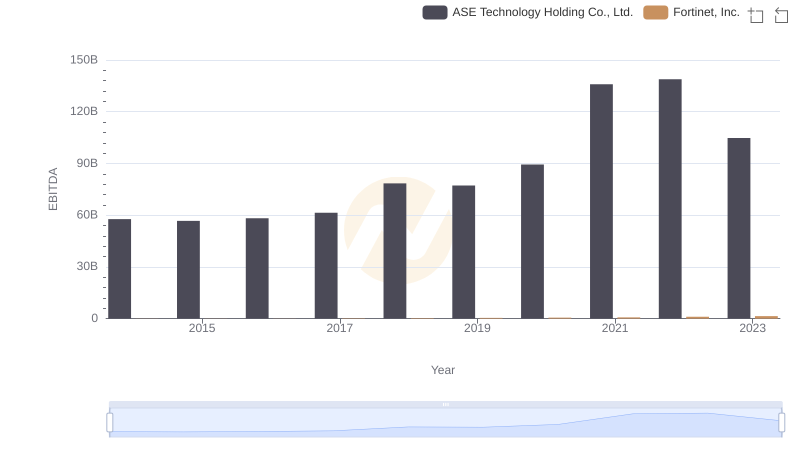
Professional EBITDA Benchmarking: Fortinet, Inc. vs ASE Technology Holding Co., Ltd.