| __timestamp | ASE Technology Holding Co., Ltd. | Fortinet, Inc. |
|---|---|---|
| Wednesday, January 1, 2014 | 53540000000 | 539355000 |
| Thursday, January 1, 2015 | 50149000000 | 722491000 |
| Friday, January 1, 2016 | 53194000000 | 937606000 |
| Sunday, January 1, 2017 | 52732000000 | 1109646000 |
| Monday, January 1, 2018 | 61163000000 | 1350800000 |
| Tuesday, January 1, 2019 | 64311000000 | 1650300000 |
| Wednesday, January 1, 2020 | 77984000000 | 2024400000 |
| Friday, January 1, 2021 | 110369000000 | 2559200000 |
| Saturday, January 1, 2022 | 134930000000 | 3332500000 |
| Sunday, January 1, 2023 | 91757132000 | 4067600000 |
| Monday, January 1, 2024 | 95687183000 | 4798200000 |
Cracking the code
In the ever-evolving landscape of global technology, Fortinet, Inc. and ASE Technology Holding Co., Ltd. stand as titans in their respective domains. Over the past decade, these companies have showcased remarkable growth in gross profit, reflecting their strategic prowess and market adaptability.
From 2014 to 2023, ASE Technology's gross profit surged by approximately 72%, peaking in 2022. This Taiwanese semiconductor giant capitalized on the global demand for advanced electronics, underscoring its pivotal role in the tech supply chain. Meanwhile, Fortinet, a leader in cybersecurity, demonstrated a staggering 654% increase in gross profit over the same period, highlighting the escalating importance of digital security in an interconnected world.
This comparative analysis not only underscores the dynamic nature of the tech industry but also offers a glimpse into the strategic directions that have propelled these companies to the forefront of their fields.
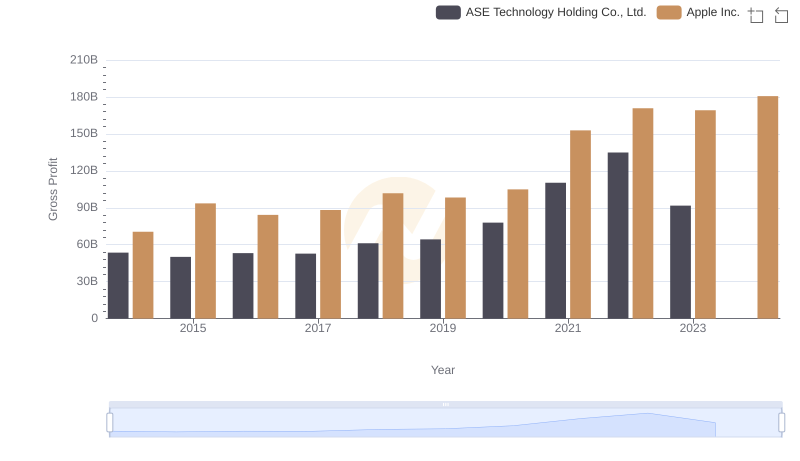
Apple Inc. vs ASE Technology Holding Co., Ltd.: A Gross Profit Performance Breakdown
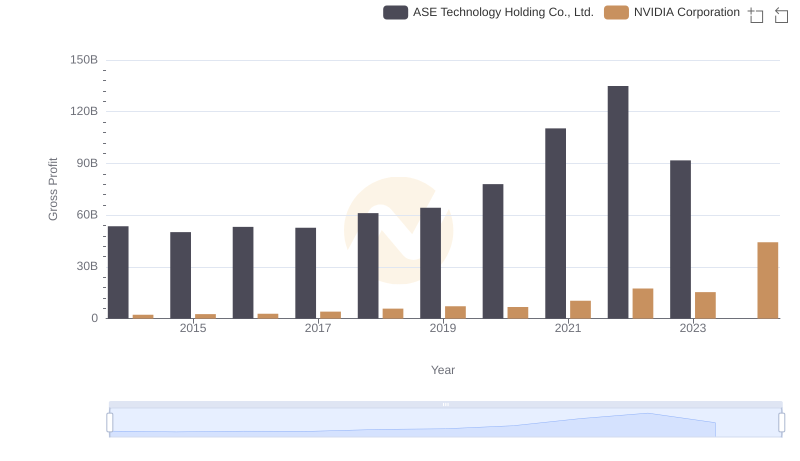
Key Insights on Gross Profit: NVIDIA Corporation vs ASE Technology Holding Co., Ltd.
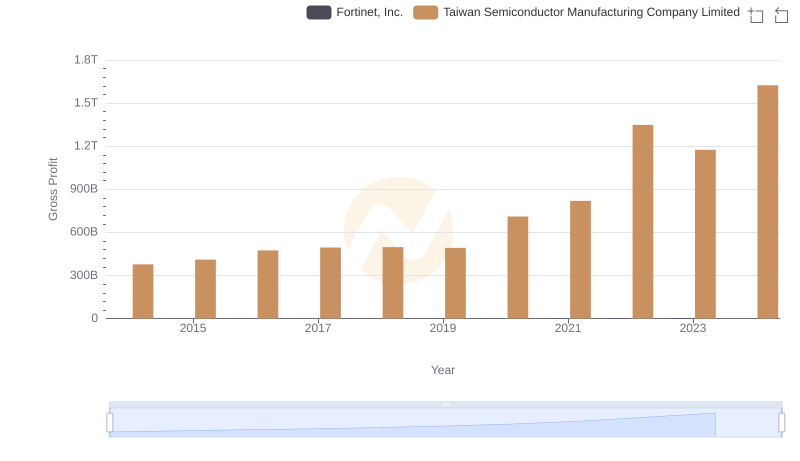
Gross Profit Comparison: Taiwan Semiconductor Manufacturing Company Limited and Fortinet, Inc. Trends
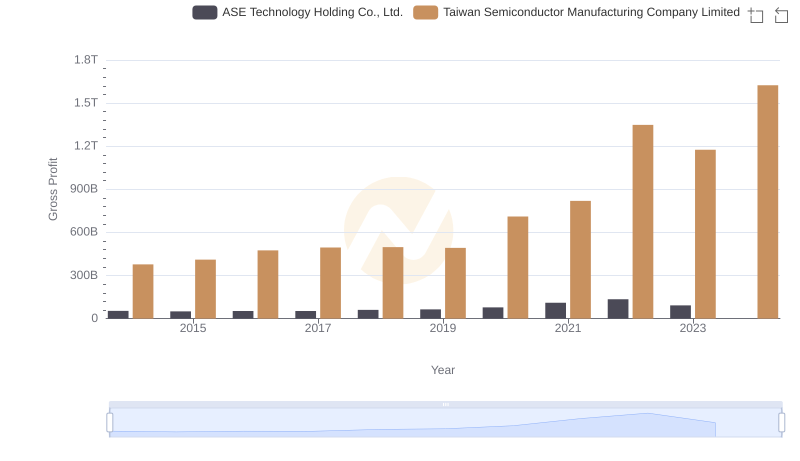
Taiwan Semiconductor Manufacturing Company Limited and ASE Technology Holding Co., Ltd.: A Detailed Gross Profit Analysis
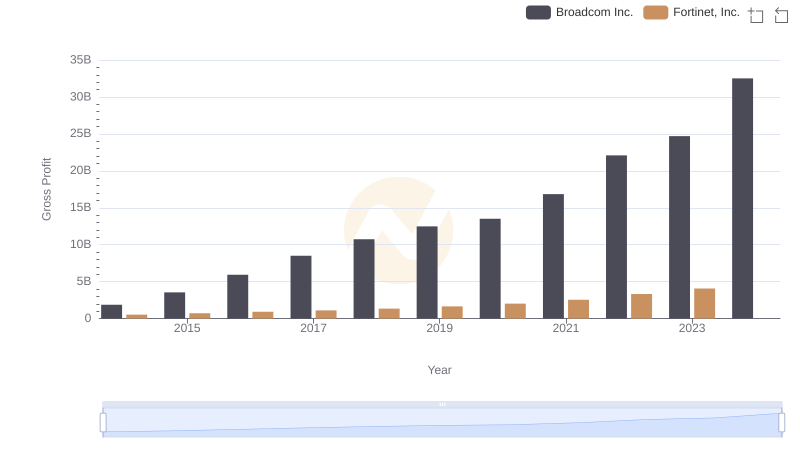
Broadcom Inc. vs Fortinet, Inc.: A Gross Profit Performance Breakdown
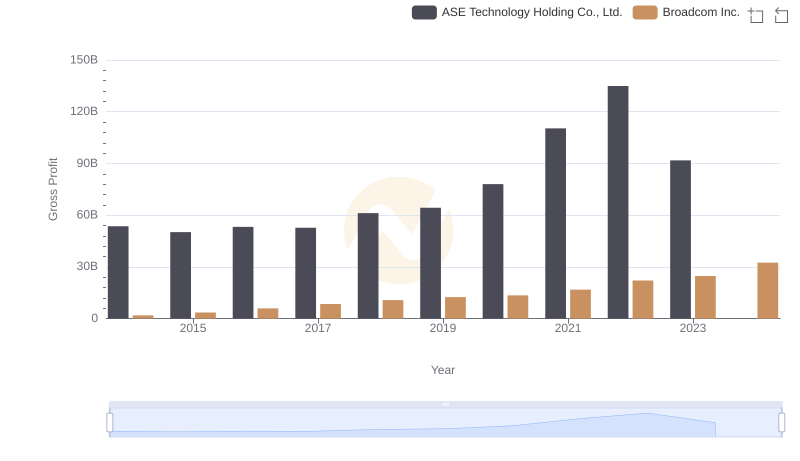
Who Generates Higher Gross Profit? Broadcom Inc. or ASE Technology Holding Co., Ltd.
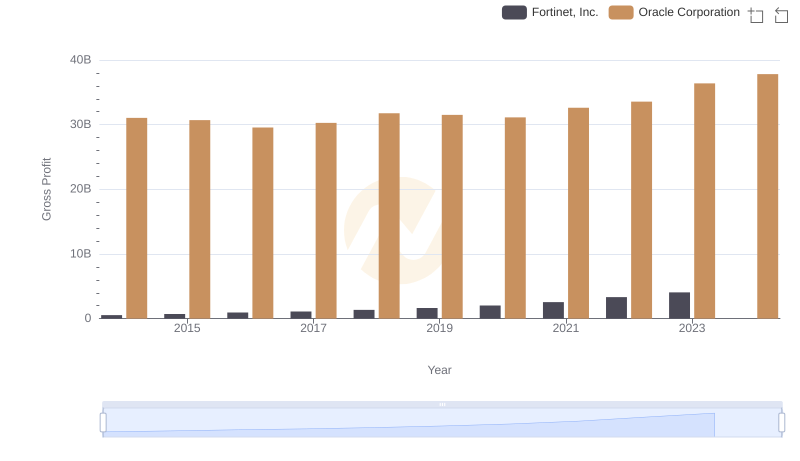
Who Generates Higher Gross Profit? Oracle Corporation or Fortinet, Inc.

Revenue Showdown: Fortinet, Inc. vs ASE Technology Holding Co., Ltd.
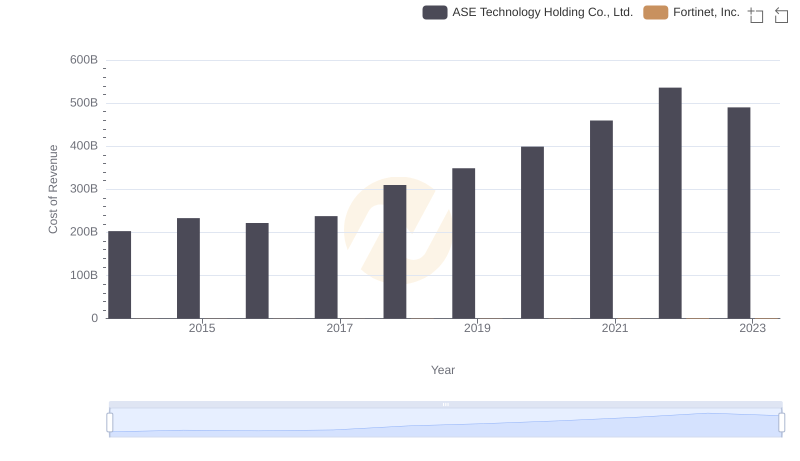
Cost of Revenue Comparison: Fortinet, Inc. vs ASE Technology Holding Co., Ltd.
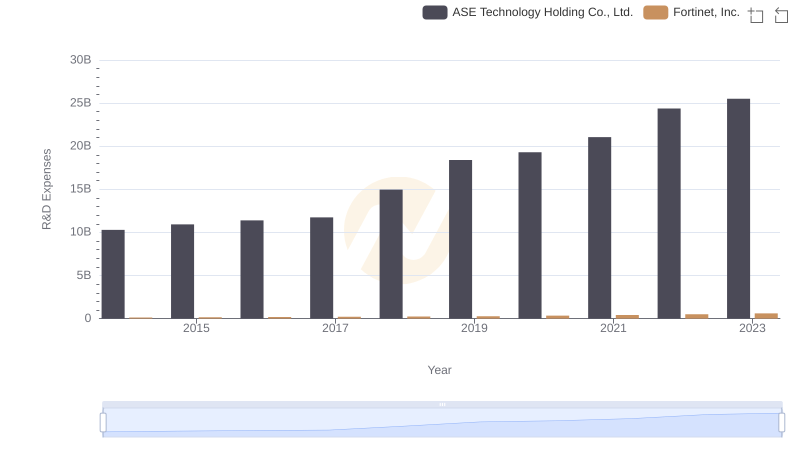
R&D Spending Showdown: Fortinet, Inc. vs ASE Technology Holding Co., Ltd.
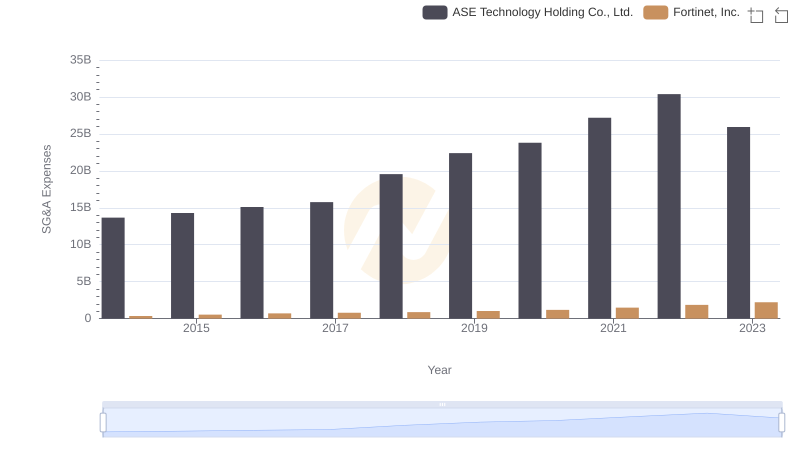
Fortinet, Inc. or ASE Technology Holding Co., Ltd.: Who Manages SG&A Costs Better?
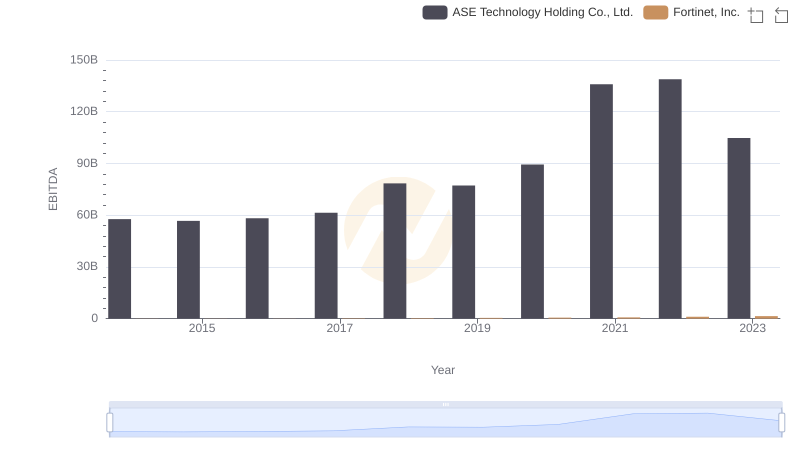
Professional EBITDA Benchmarking: Fortinet, Inc. vs ASE Technology Holding Co., Ltd.