| __timestamp | ASE Technology Holding Co., Ltd. | Fortinet, Inc. |
|---|---|---|
| Wednesday, January 1, 2014 | 203051000000 | 231009000 |
| Thursday, January 1, 2015 | 233153000000 | 286777000 |
| Friday, January 1, 2016 | 221690000000 | 337837000 |
| Sunday, January 1, 2017 | 237709000000 | 385284000 |
| Monday, January 1, 2018 | 309929000000 | 450400000 |
| Tuesday, January 1, 2019 | 348871000000 | 505900000 |
| Wednesday, January 1, 2020 | 398994000000 | 570000000 |
| Friday, January 1, 2021 | 459628000000 | 783000000 |
| Saturday, January 1, 2022 | 535943000000 | 1084900000 |
| Sunday, January 1, 2023 | 490157339000 | 1237200000 |
| Monday, January 1, 2024 | 499722880000 | 1157600000 |
Unlocking the unknown
In the ever-evolving landscape of technology, Fortinet, Inc. and ASE Technology Holding Co., Ltd. stand as titans in their respective fields. Over the past decade, from 2014 to 2023, these companies have shown contrasting trajectories in their cost of revenue. Fortinet, a leader in cybersecurity, has seen its cost of revenue grow by over 400%, reflecting its aggressive expansion and innovation strategies. In contrast, ASE Technology, a semiconductor giant, has experienced a more modest increase of around 140%, indicative of its stable yet steady growth in the semiconductor industry. This comparison not only highlights the dynamic nature of the tech industry but also underscores the diverse strategies companies employ to maintain their competitive edge. As we look to the future, these trends offer valuable insights into the operational efficiencies and market strategies of these industry leaders.
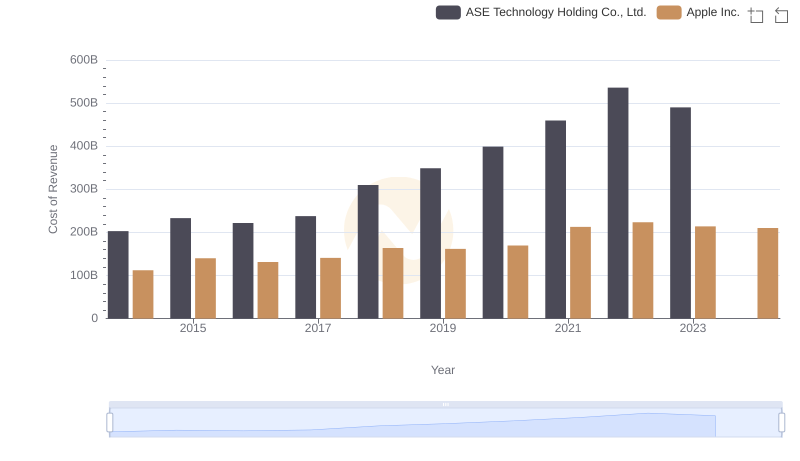
Comparing Cost of Revenue Efficiency: Apple Inc. vs ASE Technology Holding Co., Ltd.
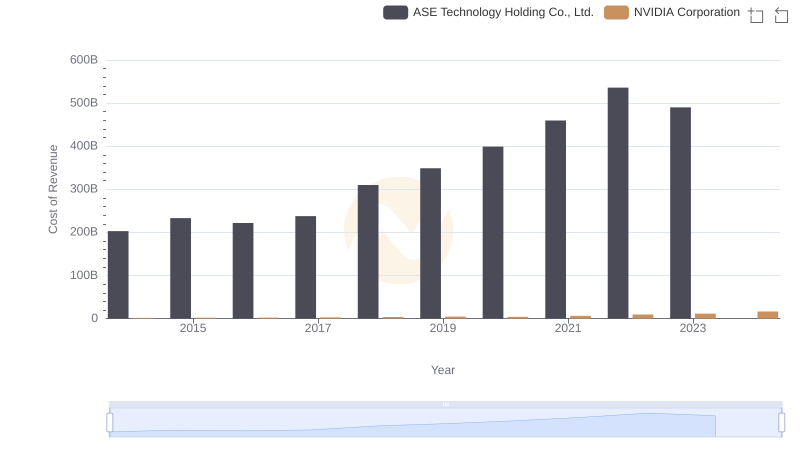
Analyzing Cost of Revenue: NVIDIA Corporation and ASE Technology Holding Co., Ltd.
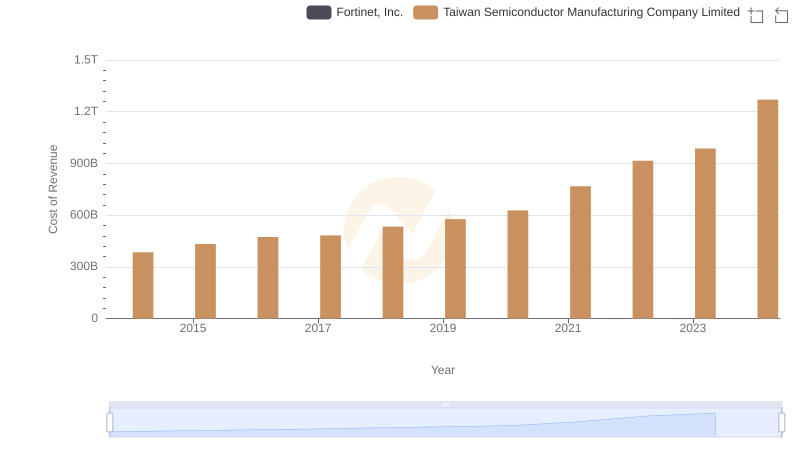
Cost Insights: Breaking Down Taiwan Semiconductor Manufacturing Company Limited and Fortinet, Inc.'s Expenses
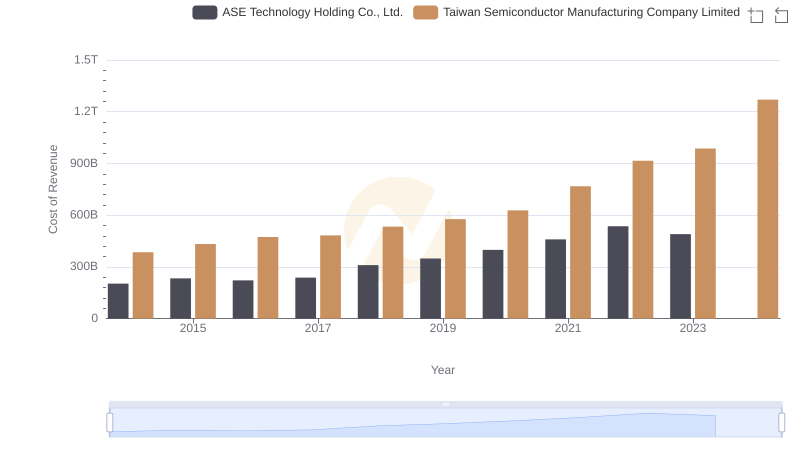
Cost Insights: Breaking Down Taiwan Semiconductor Manufacturing Company Limited and ASE Technology Holding Co., Ltd.'s Expenses
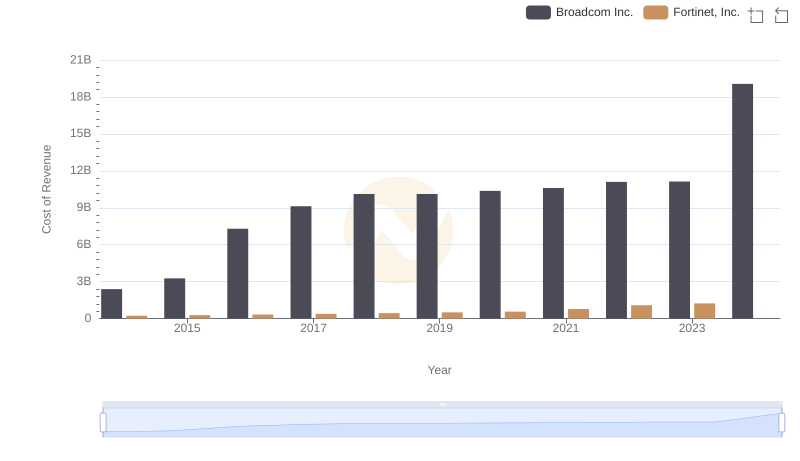
Cost of Revenue: Key Insights for Broadcom Inc. and Fortinet, Inc.
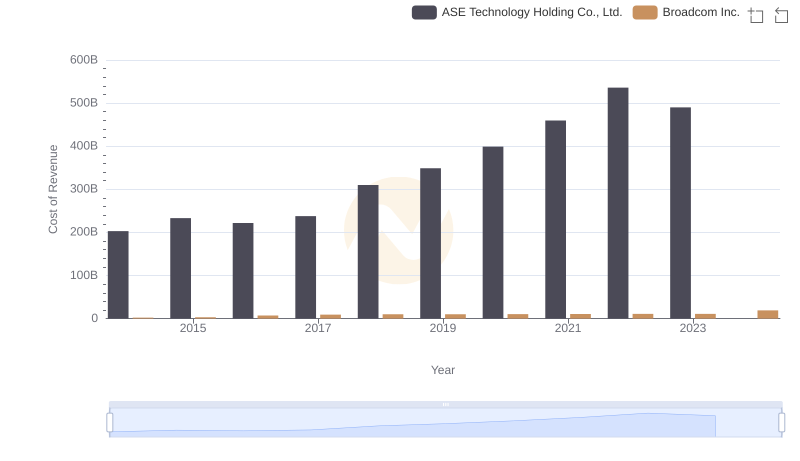
Analyzing Cost of Revenue: Broadcom Inc. and ASE Technology Holding Co., Ltd.
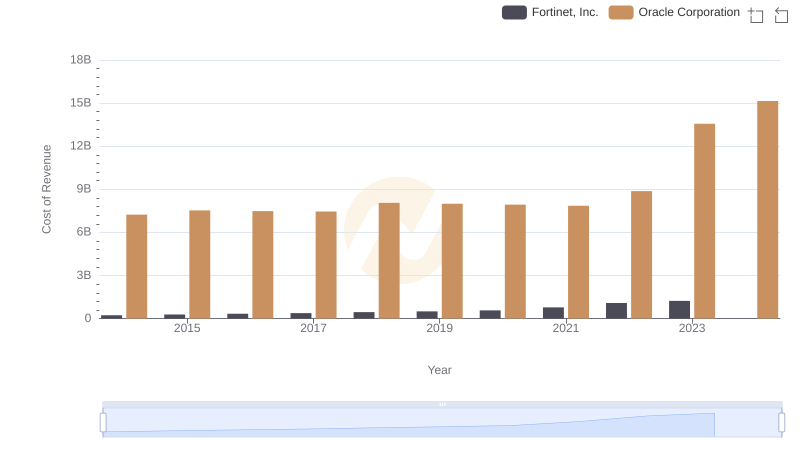
Cost of Revenue: Key Insights for Oracle Corporation and Fortinet, Inc.

Revenue Showdown: Fortinet, Inc. vs ASE Technology Holding Co., Ltd.
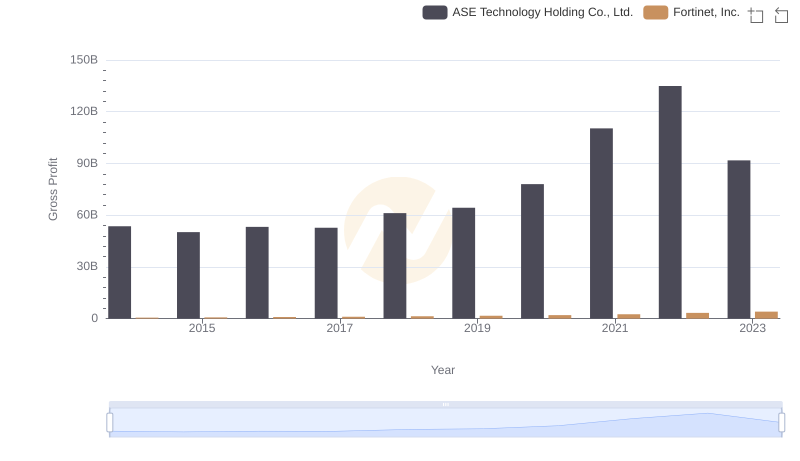
Key Insights on Gross Profit: Fortinet, Inc. vs ASE Technology Holding Co., Ltd.
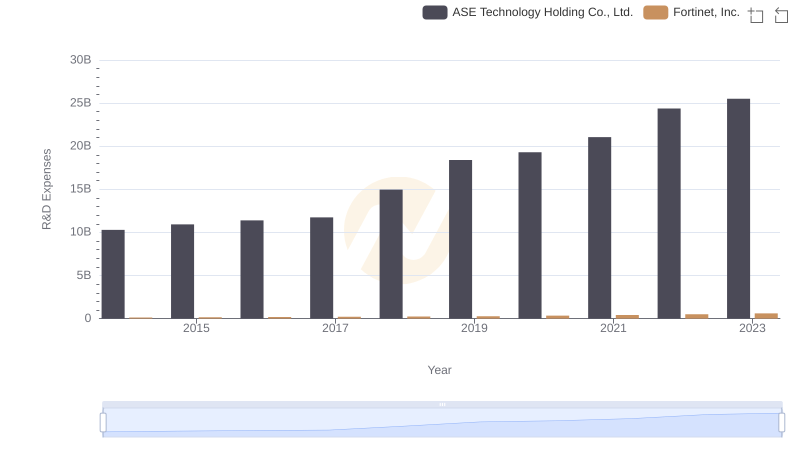
R&D Spending Showdown: Fortinet, Inc. vs ASE Technology Holding Co., Ltd.
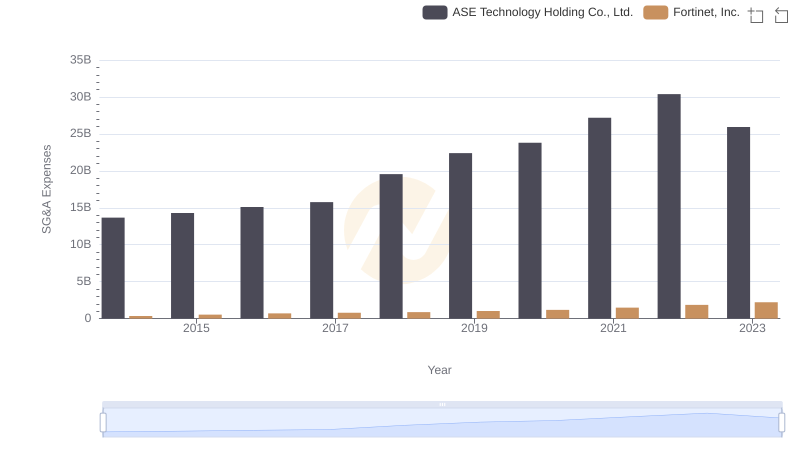
Fortinet, Inc. or ASE Technology Holding Co., Ltd.: Who Manages SG&A Costs Better?
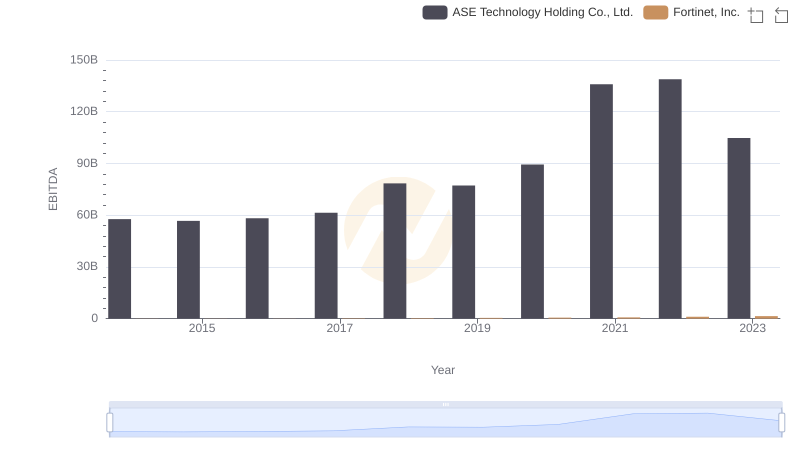
Professional EBITDA Benchmarking: Fortinet, Inc. vs ASE Technology Holding Co., Ltd.