| __timestamp | ASE Technology Holding Co., Ltd. | Fortinet, Inc. |
|---|---|---|
| Wednesday, January 1, 2014 | 57728376000 | 81352000 |
| Thursday, January 1, 2015 | 56716330000 | 55766000 |
| Friday, January 1, 2016 | 58196307000 | 91668000 |
| Sunday, January 1, 2017 | 61377328000 | 179470000 |
| Monday, January 1, 2018 | 78432873000 | 286700000 |
| Tuesday, January 1, 2019 | 77173662000 | 412600000 |
| Wednesday, January 1, 2020 | 89377502000 | 560400000 |
| Friday, January 1, 2021 | 135966088000 | 727700000 |
| Saturday, January 1, 2022 | 138852591000 | 1077800000 |
| Sunday, January 1, 2023 | 104757657000 | 1468100000 |
| Monday, January 1, 2024 | 104735170000 | 1803400000 |
Unveiling the hidden dimensions of data
In the ever-evolving landscape of global technology, understanding financial performance is crucial. This analysis delves into the EBITDA trends of two industry giants: Fortinet, Inc. and ASE Technology Holding Co., Ltd., from 2014 to 2023. Over this period, ASE Technology consistently outperformed Fortinet, with EBITDA figures peaking at approximately 1.39 times higher in 2022 compared to 2014. Fortinet, on the other hand, showcased a remarkable growth trajectory, with its EBITDA increasing by over 1,700% during the same period. This stark contrast highlights ASE Technology's established market presence and Fortinet's rapid growth in the cybersecurity sector. As we move forward, these trends offer valuable insights into the strategic positioning and financial health of these companies, providing a benchmark for investors and industry analysts alike.
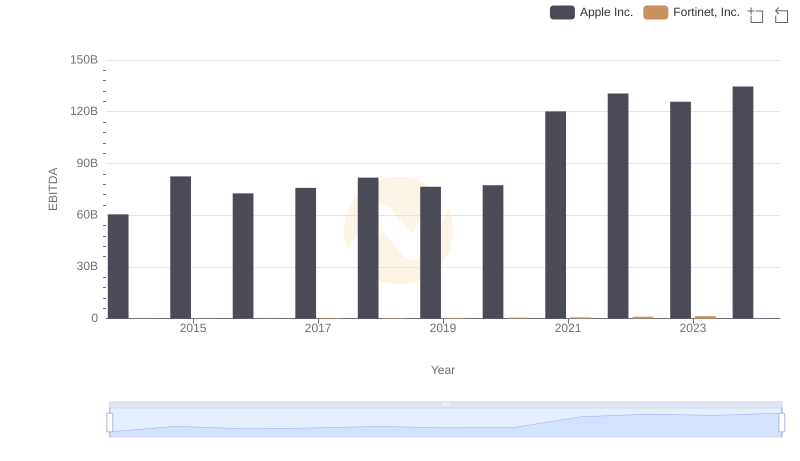
Professional EBITDA Benchmarking: Apple Inc. vs Fortinet, Inc.
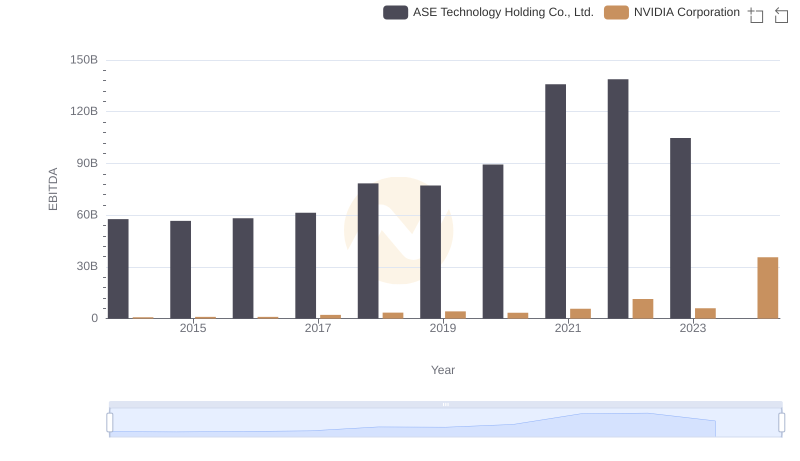
Comparative EBITDA Analysis: NVIDIA Corporation vs ASE Technology Holding Co., Ltd.
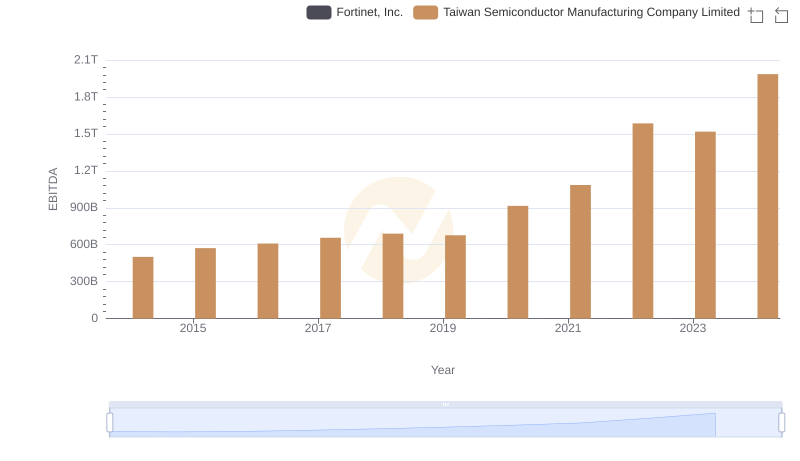
Professional EBITDA Benchmarking: Taiwan Semiconductor Manufacturing Company Limited vs Fortinet, Inc.
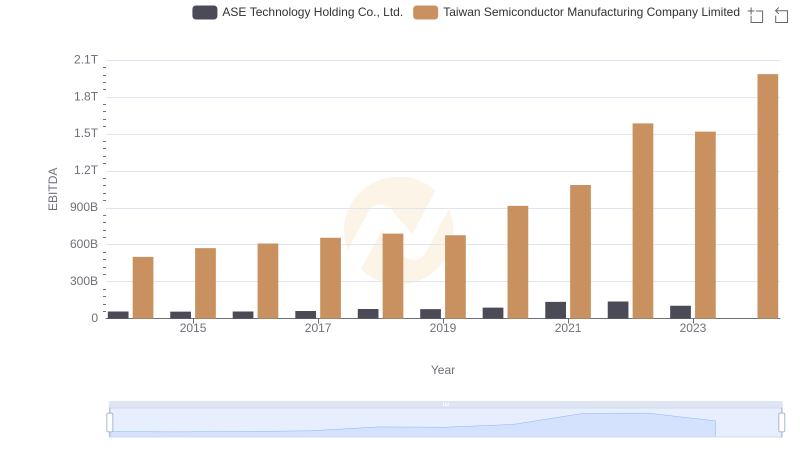
EBITDA Performance Review: Taiwan Semiconductor Manufacturing Company Limited vs ASE Technology Holding Co., Ltd.
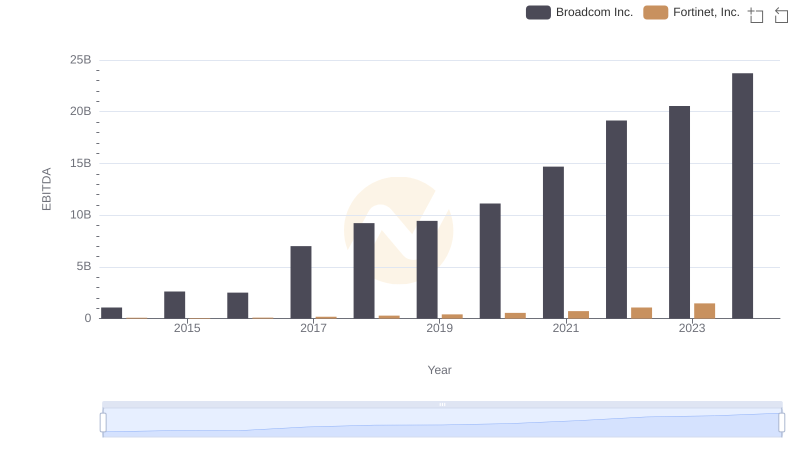
Comparative EBITDA Analysis: Broadcom Inc. vs Fortinet, Inc.
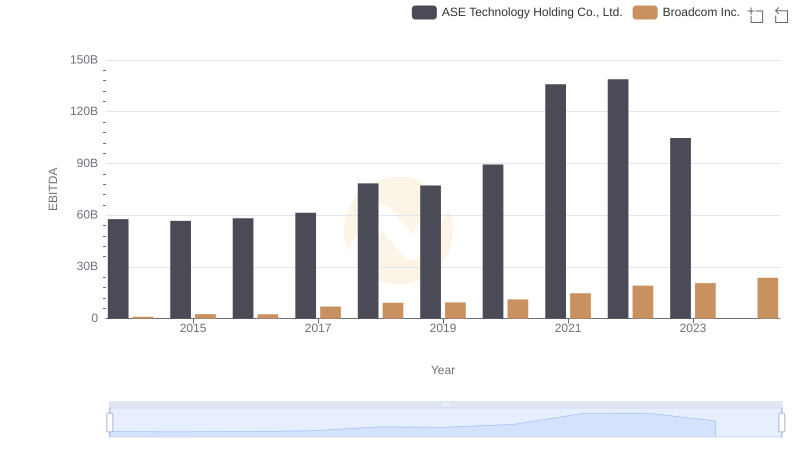
Professional EBITDA Benchmarking: Broadcom Inc. vs ASE Technology Holding Co., Ltd.
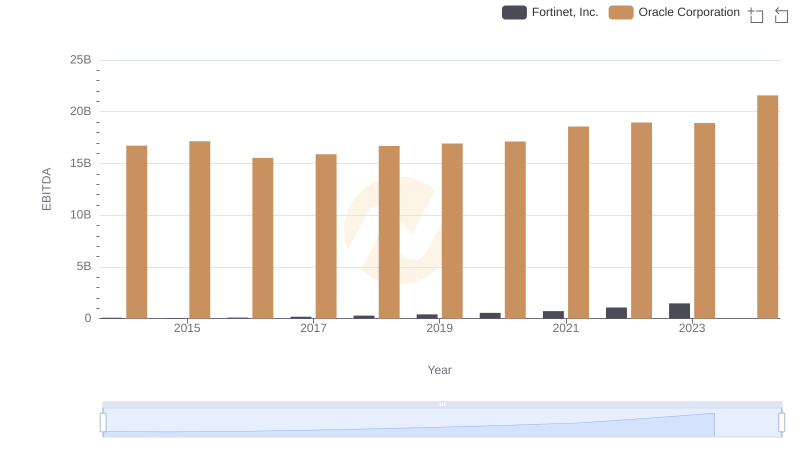
EBITDA Performance Review: Oracle Corporation vs Fortinet, Inc.

Revenue Showdown: Fortinet, Inc. vs ASE Technology Holding Co., Ltd.
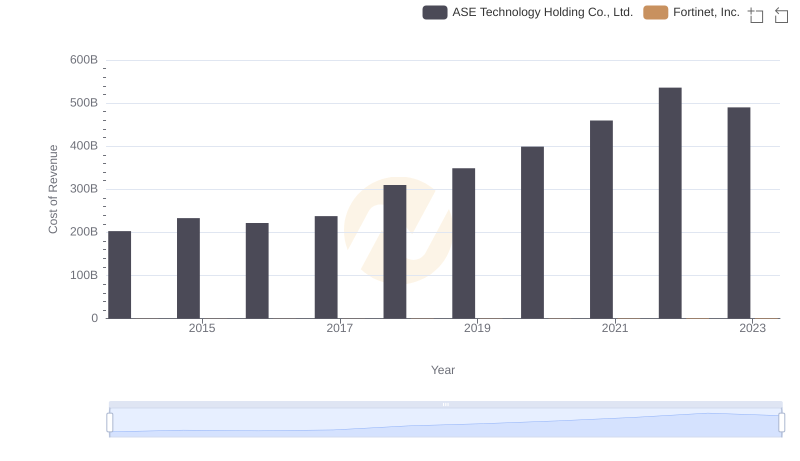
Cost of Revenue Comparison: Fortinet, Inc. vs ASE Technology Holding Co., Ltd.
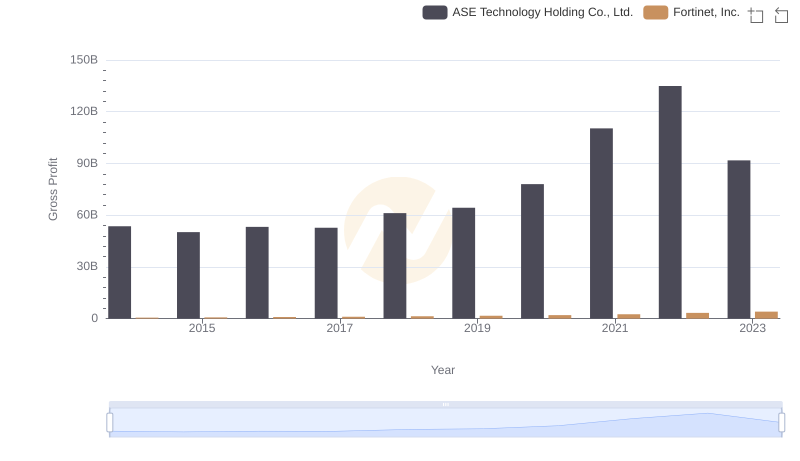
Key Insights on Gross Profit: Fortinet, Inc. vs ASE Technology Holding Co., Ltd.
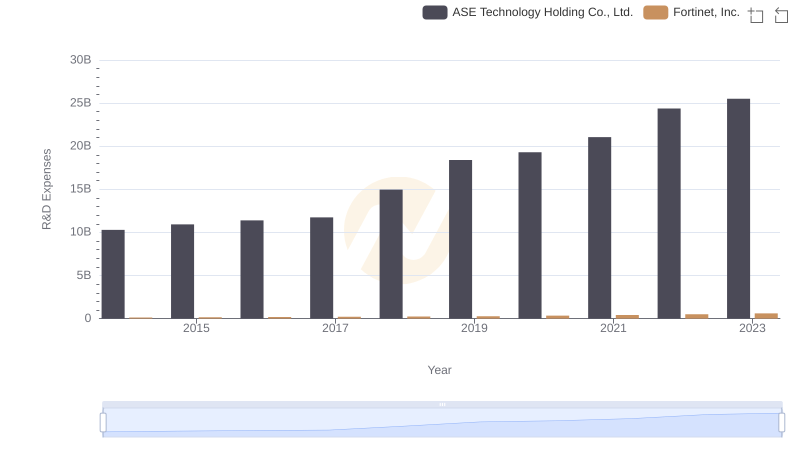
R&D Spending Showdown: Fortinet, Inc. vs ASE Technology Holding Co., Ltd.
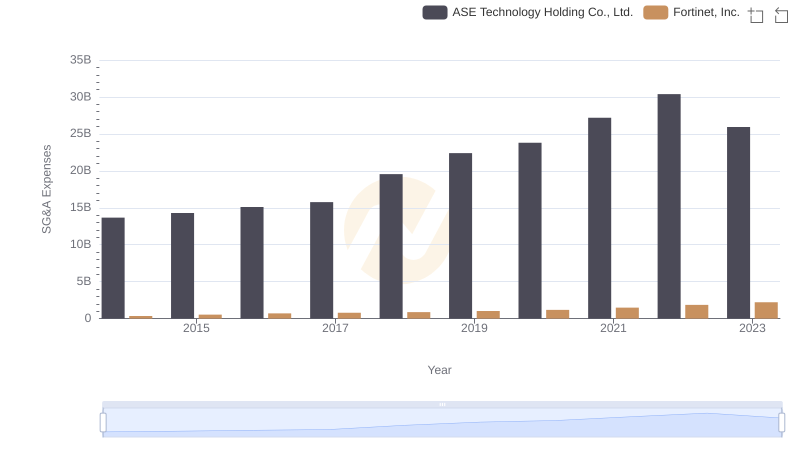
Fortinet, Inc. or ASE Technology Holding Co., Ltd.: Who Manages SG&A Costs Better?