| __timestamp | Equifax Inc. | ZTO Express (Cayman) Inc. |
|---|---|---|
| Wednesday, January 1, 2014 | 842400000 | 876815000 |
| Thursday, January 1, 2015 | 914600000 | 1687285000 |
| Friday, January 1, 2016 | 1116900000 | 3093956000 |
| Sunday, January 1, 2017 | 1013900000 | 4308801000 |
| Monday, January 1, 2018 | 770200000 | 5185941000 |
| Tuesday, January 1, 2019 | 29000000 | 6727397000 |
| Wednesday, January 1, 2020 | 1217800000 | 5197064000 |
| Friday, January 1, 2021 | 1575200000 | 5866901000 |
| Saturday, January 1, 2022 | 1672800000 | 11147519000 |
| Sunday, January 1, 2023 | 1579100000 | 13853443000 |
| Monday, January 1, 2024 | 1251200000 |
Unlocking the unknown
In the ever-evolving landscape of global business, understanding the financial health of companies is crucial. This analysis delves into the EBITDA performance of Equifax Inc. and ZTO Express (Cayman) Inc. from 2014 to 2023. Over this period, ZTO Express has consistently outperformed Equifax, with its EBITDA growing by approximately 1,480% from 2014 to 2023. In contrast, Equifax's EBITDA saw a more modest increase of around 87% during the same timeframe.
The year 2022 marked a significant milestone for ZTO Express, as its EBITDA surged to over 11 billion, a remarkable 90% increase from the previous year. Meanwhile, Equifax reached its peak EBITDA in 2022, with a 6% increase from 2021. This data highlights the dynamic growth of ZTO Express in the logistics sector, while Equifax continues to maintain steady progress in the credit reporting industry.
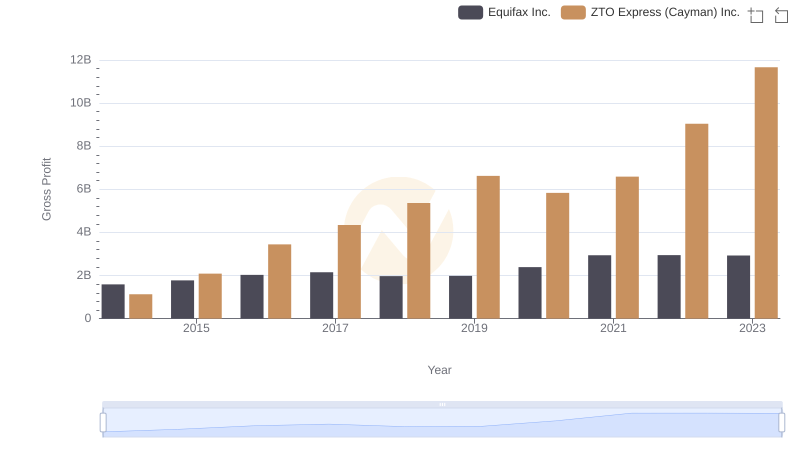
Who Generates Higher Gross Profit? Equifax Inc. or ZTO Express (Cayman) Inc.
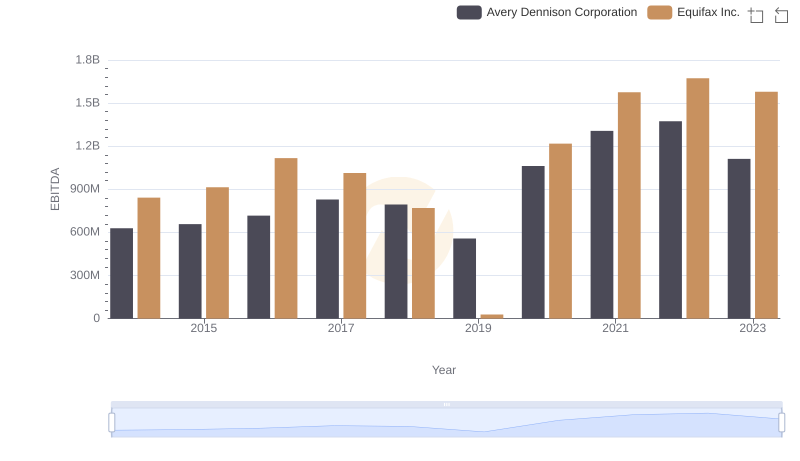
EBITDA Metrics Evaluated: Equifax Inc. vs Avery Dennison Corporation
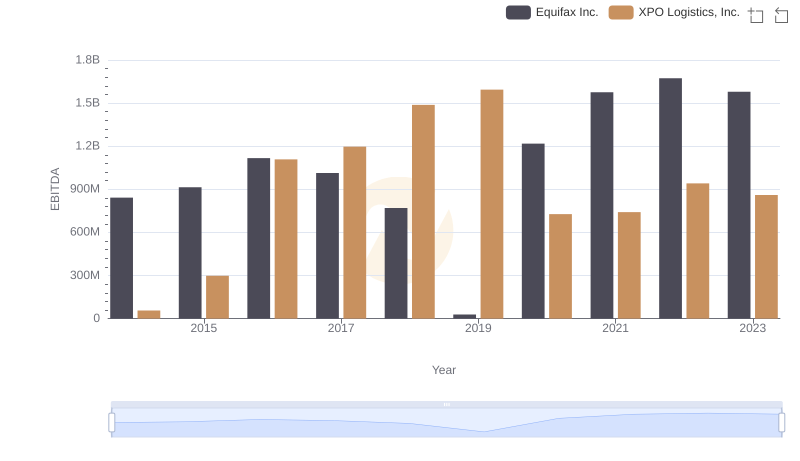
Professional EBITDA Benchmarking: Equifax Inc. vs XPO Logistics, Inc.
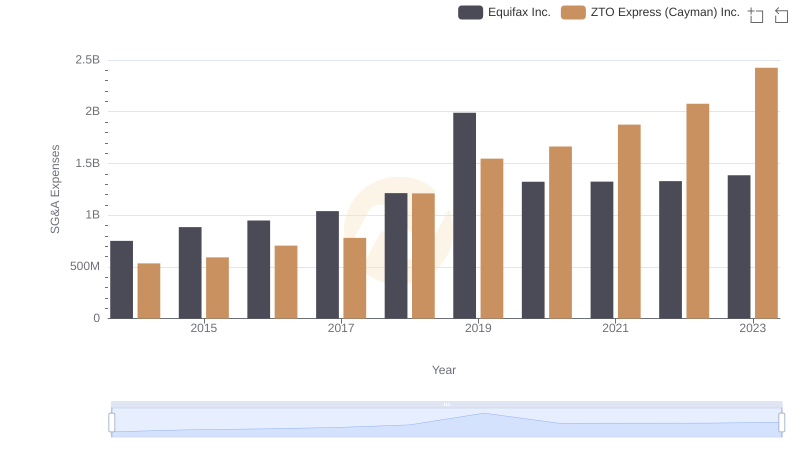
Who Optimizes SG&A Costs Better? Equifax Inc. or ZTO Express (Cayman) Inc.
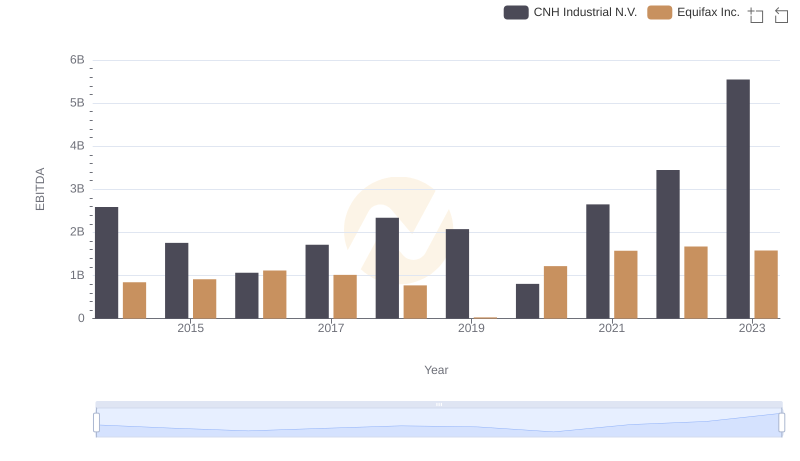
Comparative EBITDA Analysis: Equifax Inc. vs CNH Industrial N.V.
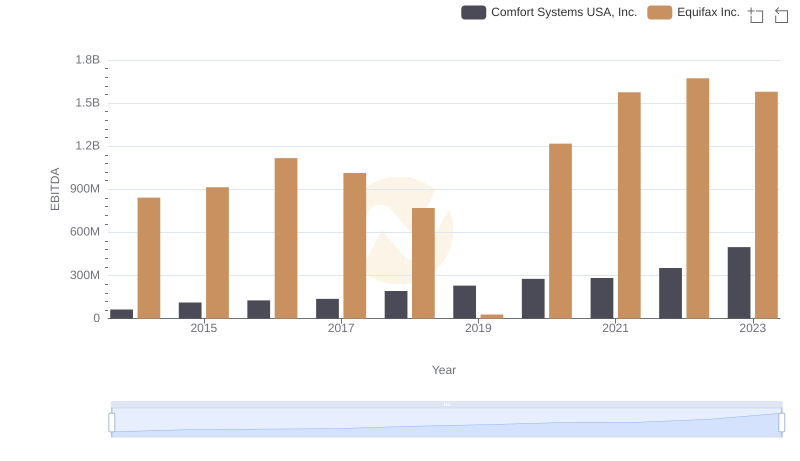
EBITDA Analysis: Evaluating Equifax Inc. Against Comfort Systems USA, Inc.