| __timestamp | Old Dominion Freight Line, Inc. | Parker-Hannifin Corporation |
|---|---|---|
| Wednesday, January 1, 2014 | 2787897000 | 13215971000 |
| Thursday, January 1, 2015 | 2972442000 | 12711744000 |
| Friday, January 1, 2016 | 2991517000 | 11360753000 |
| Sunday, January 1, 2017 | 3358112000 | 12029312000 |
| Monday, January 1, 2018 | 4043695000 | 14302392000 |
| Tuesday, January 1, 2019 | 4109111000 | 14320324000 |
| Wednesday, January 1, 2020 | 4015129000 | 13695520000 |
| Friday, January 1, 2021 | 5256328000 | 14347640000 |
| Saturday, January 1, 2022 | 6260077000 | 15861608000 |
| Sunday, January 1, 2023 | 5866152000 | 19065194000 |
| Monday, January 1, 2024 | 19929606000 |
Unleashing the power of data
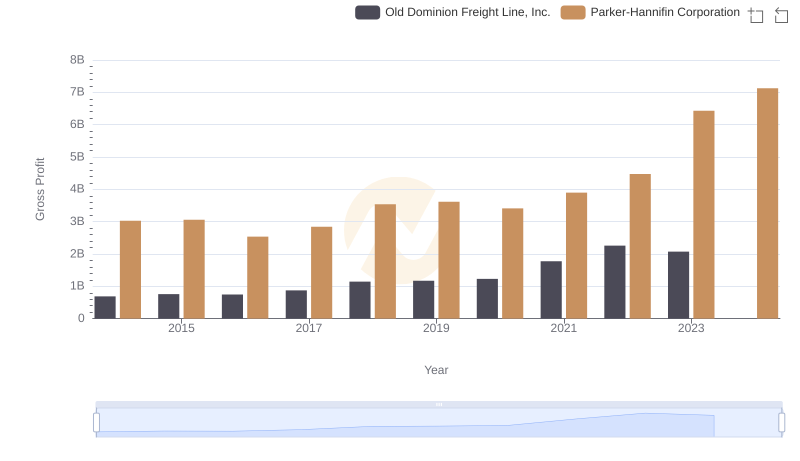
In the ever-evolving landscape of industrial and freight sectors, Parker-Hannifin Corporation and Old Dominion Freight Line, Inc. have showcased intriguing revenue trajectories over the past decade. From 2014 to 2023, Parker-Hannifin's revenue surged by approximately 44%, peaking at nearly $19 billion in 2023. This growth underscores its robust position in the motion and control technologies market.
Conversely, Old Dominion Freight Line, a leader in the freight industry, experienced a remarkable 110% increase in revenue from 2014 to 2022, reaching over $6 billion. However, 2023 saw a slight dip, highlighting potential market challenges.
These trends reflect broader economic shifts and industry-specific dynamics. While Parker-Hannifin capitalizes on technological advancements, Old Dominion navigates the complexities of freight logistics. Missing data for 2024 suggests an opportunity for further analysis as these giants continue to shape their respective industries.

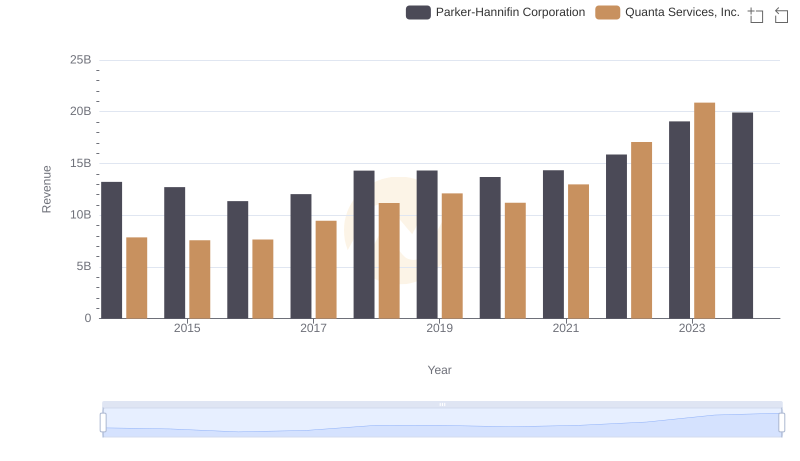
Comparing Revenue Performance: Parker-Hannifin Corporation or Quanta Services, Inc.?

Comparing Revenue Performance: Parker-Hannifin Corporation or L3Harris Technologies, Inc.?

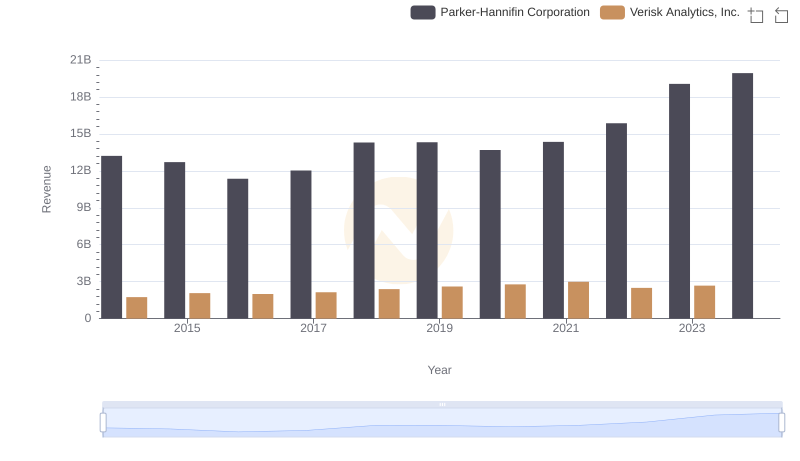
Breaking Down Revenue Trends: Parker-Hannifin Corporation vs Verisk Analytics, Inc.

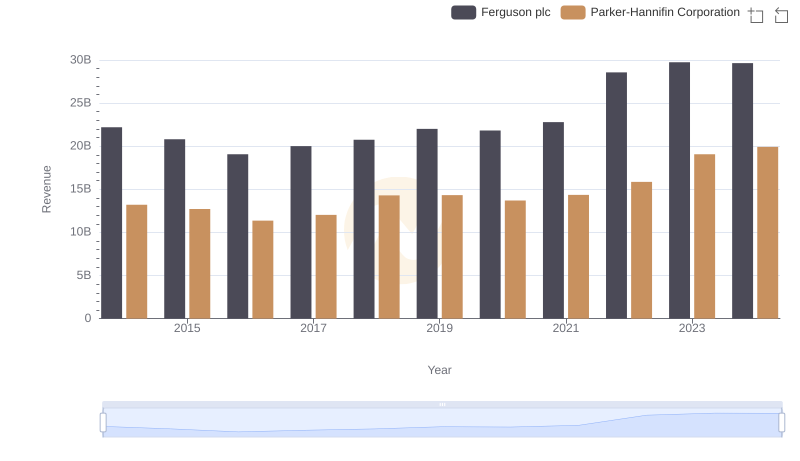
Parker-Hannifin Corporation vs Ferguson plc: Annual Revenue Growth Compared

Parker-Hannifin Corporation vs Old Dominion Freight Line, Inc.: A Gross Profit Performance Breakdown

Cost Management Insights: SG&A Expenses for Parker-Hannifin Corporation and Old Dominion Freight Line, Inc.