| __timestamp | Parker-Hannifin Corporation | Rentokil Initial plc |
|---|---|---|
| Wednesday, January 1, 2014 | 13215971000 | 1740800000 |
| Thursday, January 1, 2015 | 12711744000 | 1759000000 |
| Friday, January 1, 2016 | 11360753000 | 2168100000 |
| Sunday, January 1, 2017 | 12029312000 | 2412300000 |
| Monday, January 1, 2018 | 14302392000 | 2472300000 |
| Tuesday, January 1, 2019 | 14320324000 | 2676200000 |
| Wednesday, January 1, 2020 | 13695520000 | 2789400000 |
| Friday, January 1, 2021 | 14347640000 | 2953900000 |
| Saturday, January 1, 2022 | 15861608000 | 3714000000 |
| Sunday, January 1, 2023 | 19065194000 | 5375000000 |
| Monday, January 1, 2024 | 19929606000 |
Igniting the spark of knowledge
In the ever-evolving landscape of industrial and service sectors, Parker-Hannifin Corporation and Rentokil Initial plc stand as significant players. Over the past decade, Parker-Hannifin has demonstrated a robust revenue growth trajectory, with a remarkable 51% increase from 2014 to 2023. This growth underscores its strategic expansions and innovations in motion and control technologies. Meanwhile, Rentokil Initial, a leader in pest control and hygiene services, has seen its revenue more than double, marking a 209% surge over the same period. This impressive growth reflects its aggressive acquisition strategy and expanding global footprint.
While Parker-Hannifin's 2024 data remains undisclosed, Rentokil's absence suggests potential strategic shifts or reporting delays.
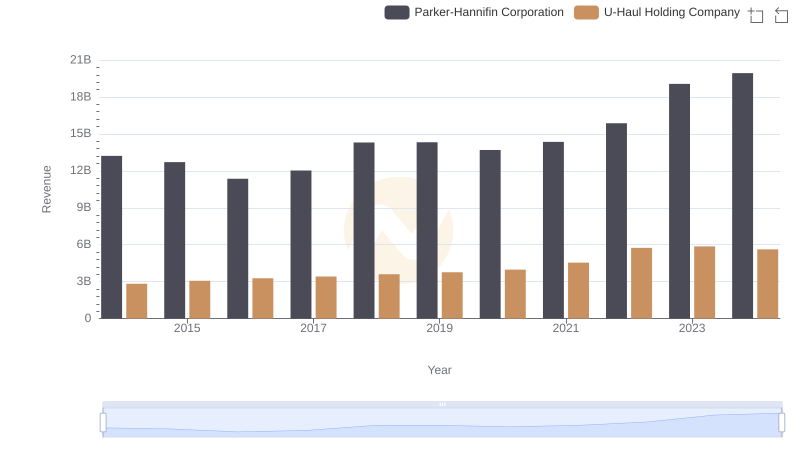
Parker-Hannifin Corporation vs U-Haul Holding Company: Annual Revenue Growth Compared
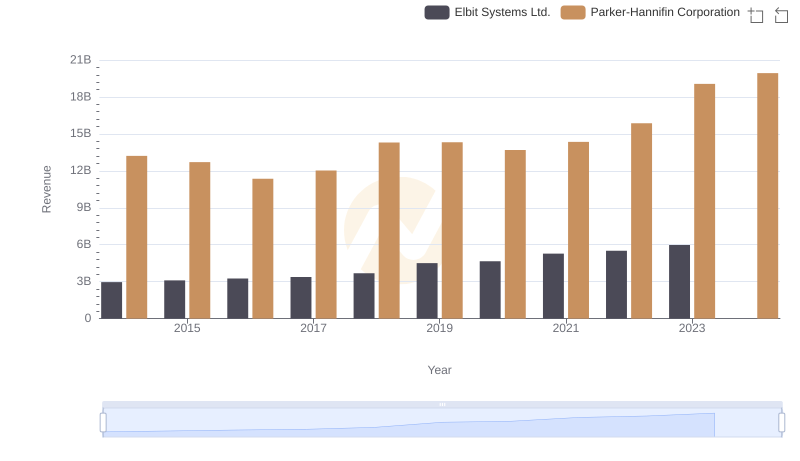
Comparing Revenue Performance: Parker-Hannifin Corporation or Elbit Systems Ltd.?
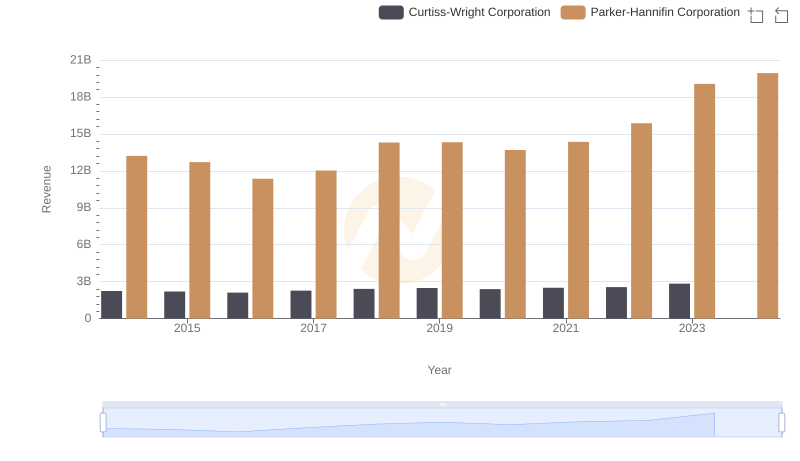
Parker-Hannifin Corporation or Curtiss-Wright Corporation: Who Leads in Yearly Revenue?
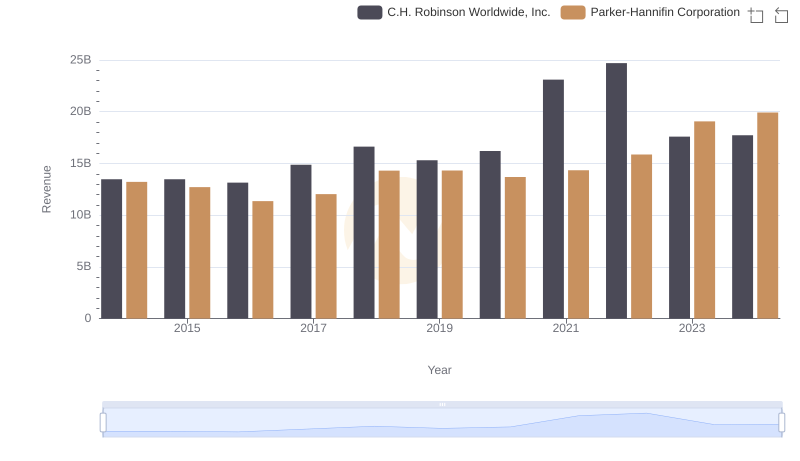
Revenue Insights: Parker-Hannifin Corporation and C.H. Robinson Worldwide, Inc. Performance Compared
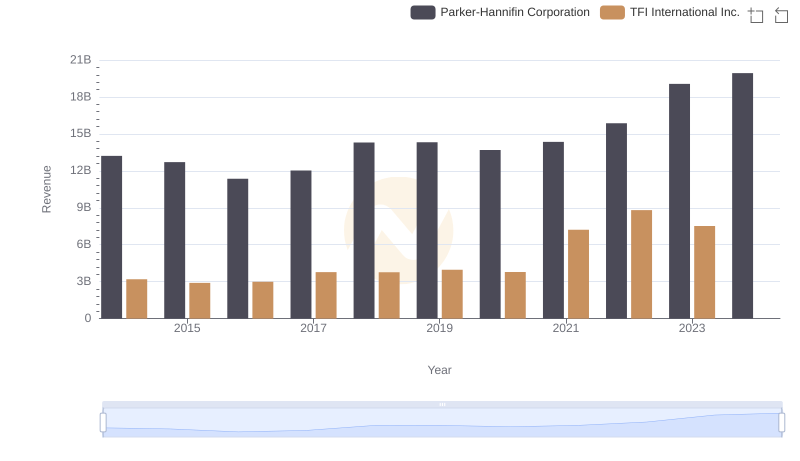
Parker-Hannifin Corporation vs TFI International Inc.: Annual Revenue Growth Compared
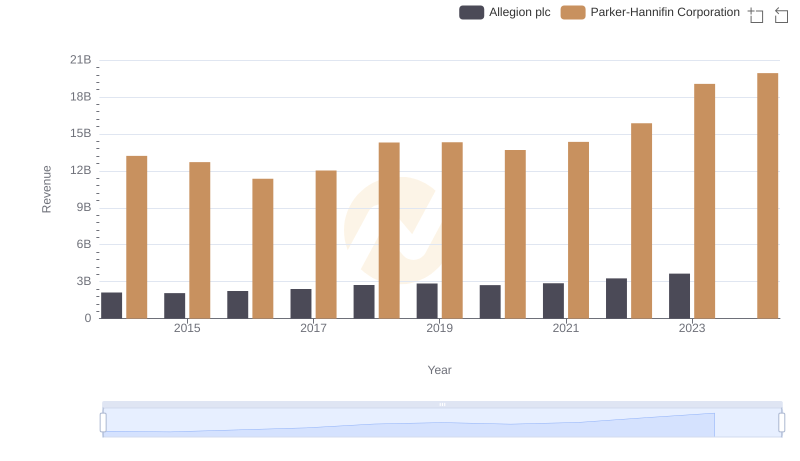
Breaking Down Revenue Trends: Parker-Hannifin Corporation vs Allegion plc
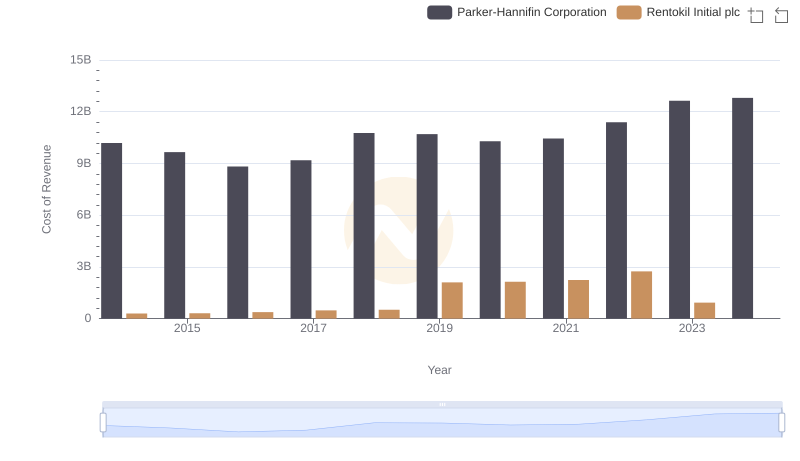
Analyzing Cost of Revenue: Parker-Hannifin Corporation and Rentokil Initial plc
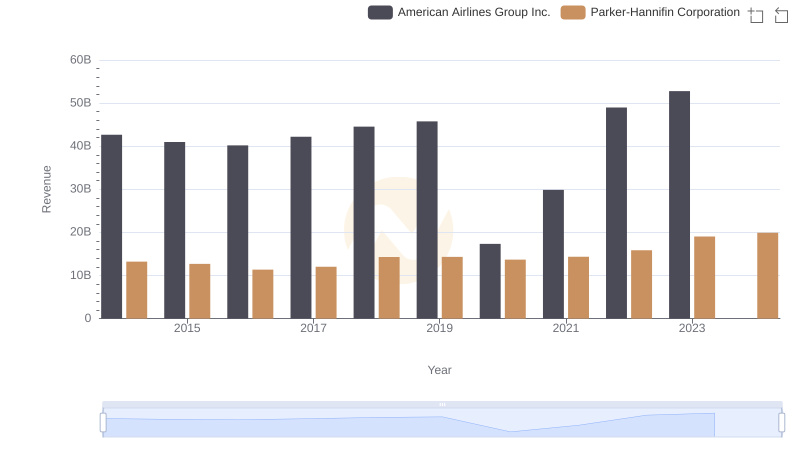
Revenue Insights: Parker-Hannifin Corporation and American Airlines Group Inc. Performance Compared
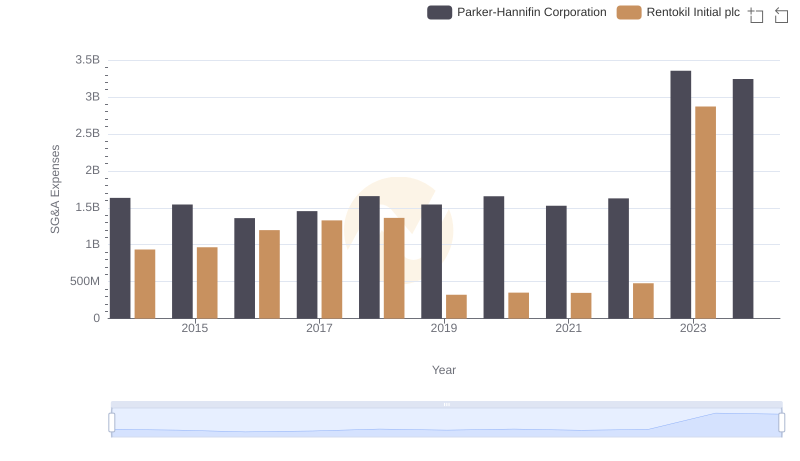
Who Optimizes SG&A Costs Better? Parker-Hannifin Corporation or Rentokil Initial plc
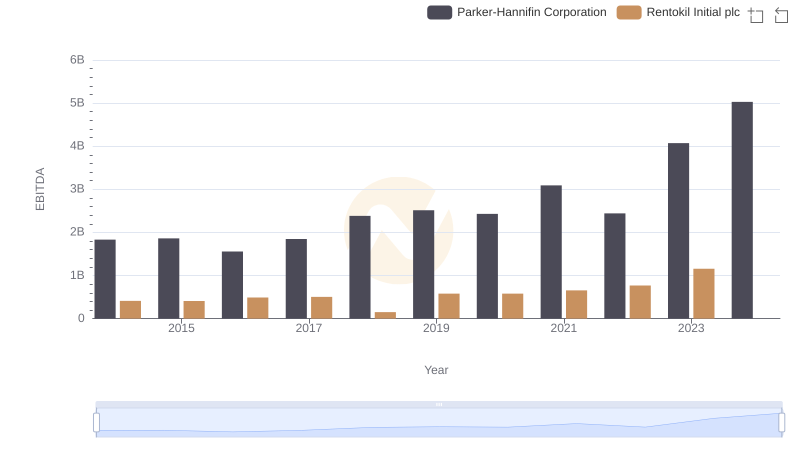
A Professional Review of EBITDA: Parker-Hannifin Corporation Compared to Rentokil Initial plc