| __timestamp | Old Dominion Freight Line, Inc. | Snap-on Incorporated |
|---|---|---|
| Wednesday, January 1, 2014 | 144817000 | 1047900000 |
| Thursday, January 1, 2015 | 153589000 | 1009100000 |
| Friday, January 1, 2016 | 152391000 | 1001400000 |
| Sunday, January 1, 2017 | 177205000 | 1101300000 |
| Monday, January 1, 2018 | 194368000 | 1080700000 |
| Tuesday, January 1, 2019 | 206125000 | 1071500000 |
| Wednesday, January 1, 2020 | 184185000 | 1054800000 |
| Friday, January 1, 2021 | 223757000 | 1202300000 |
| Saturday, January 1, 2022 | 258883000 | 1181200000 |
| Sunday, January 1, 2023 | 281053000 | 1249000000 |
| Monday, January 1, 2024 | 0 |
Unleashing the power of data
In the ever-evolving landscape of corporate finance, understanding the trends in Selling, General, and Administrative (SG&A) expenses is crucial for investors and analysts alike. Over the past decade, Old Dominion Freight Line, Inc. and Snap-on Incorporated have showcased distinct trajectories in their SG&A expenditures. From 2014 to 2023, Old Dominion Freight Line saw a remarkable 94% increase in SG&A expenses, reflecting its strategic investments in operational efficiency and market expansion. In contrast, Snap-on Incorporated maintained a more stable SG&A growth, with a modest 19% rise over the same period, indicating a focus on cost control and steady growth. This divergence highlights the differing strategic priorities of these two industry giants. As we look to the future, these trends offer valuable insights into the financial health and strategic direction of each company.
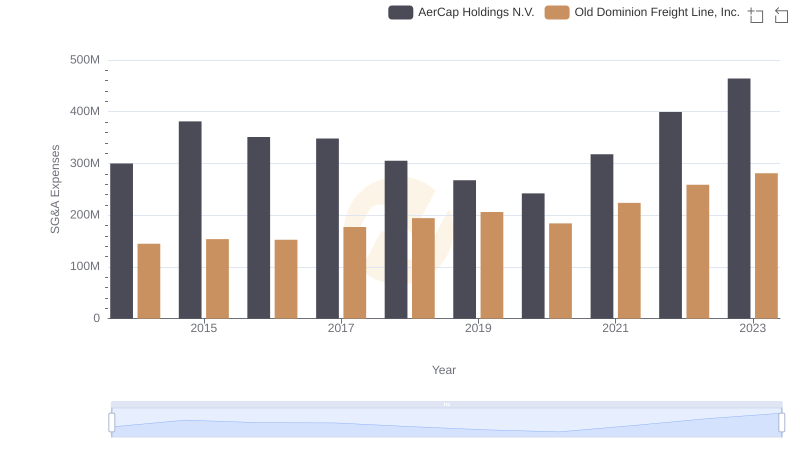
Comparing SG&A Expenses: Old Dominion Freight Line, Inc. vs AerCap Holdings N.V. Trends and Insights
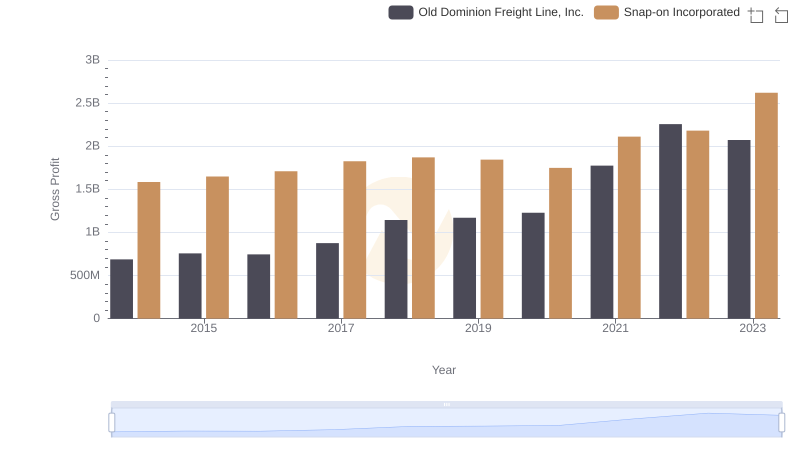
Old Dominion Freight Line, Inc. vs Snap-on Incorporated: A Gross Profit Performance Breakdown
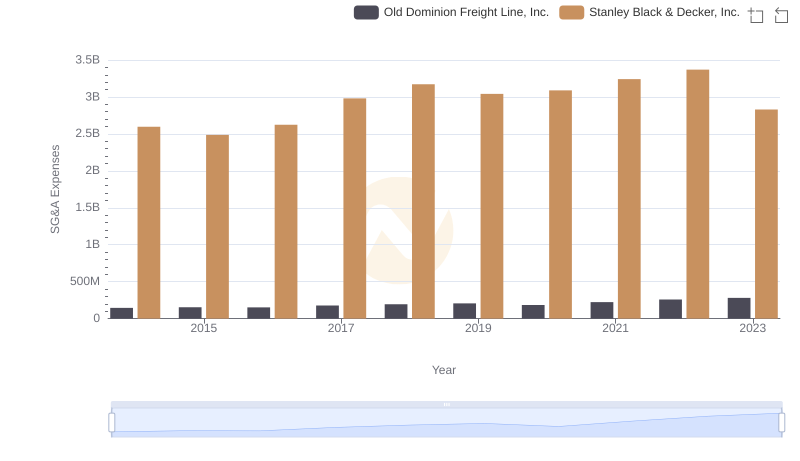
Old Dominion Freight Line, Inc. or Stanley Black & Decker, Inc.: Who Manages SG&A Costs Better?
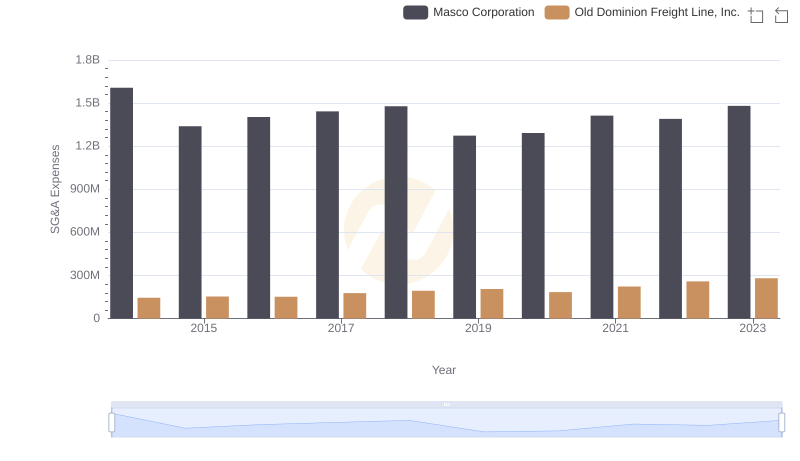
Old Dominion Freight Line, Inc. vs Masco Corporation: SG&A Expense Trends
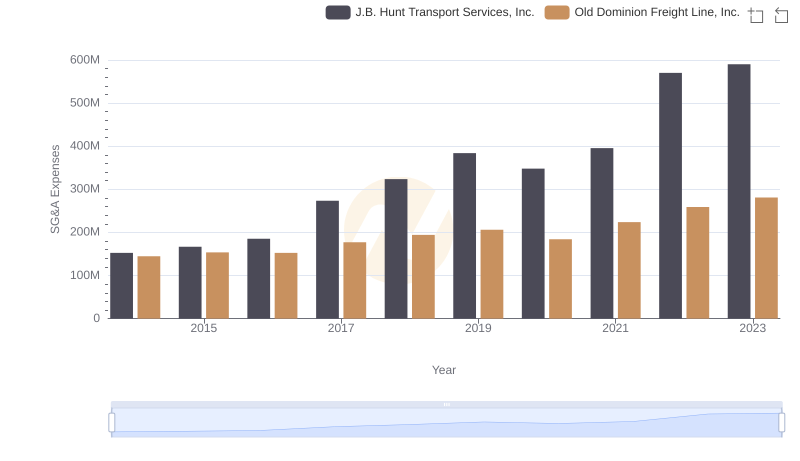
Old Dominion Freight Line, Inc. or J.B. Hunt Transport Services, Inc.: Who Manages SG&A Costs Better?
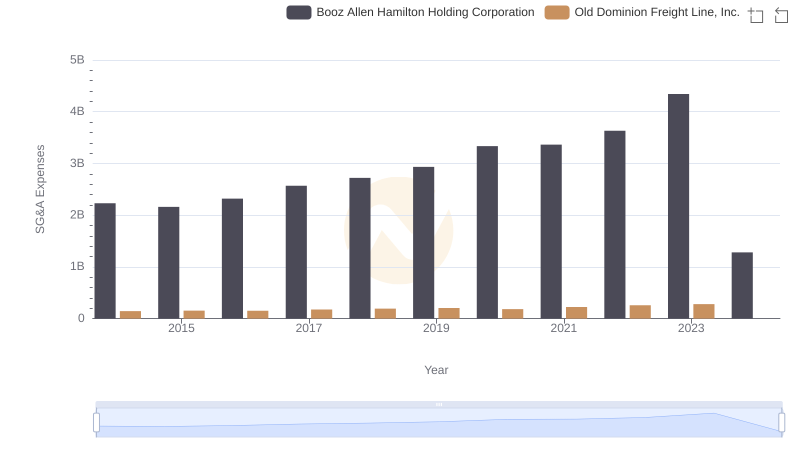
Who Optimizes SG&A Costs Better? Old Dominion Freight Line, Inc. or Booz Allen Hamilton Holding Corporation