| __timestamp | NetApp, Inc. | Zebra Technologies Corporation |
|---|---|---|
| Wednesday, January 1, 2014 | 6325100000 | 1670572000 |
| Thursday, January 1, 2015 | 6122700000 | 3651972000 |
| Friday, January 1, 2016 | 5546000000 | 3574000000 |
| Sunday, January 1, 2017 | 5519000000 | 3722000000 |
| Monday, January 1, 2018 | 5911000000 | 4218000000 |
| Tuesday, January 1, 2019 | 6146000000 | 4485000000 |
| Wednesday, January 1, 2020 | 5412000000 | 4448000000 |
| Friday, January 1, 2021 | 5744000000 | 5627000000 |
| Saturday, January 1, 2022 | 6318000000 | 5781000000 |
| Sunday, January 1, 2023 | 6362000000 | 4584000000 |
| Monday, January 1, 2024 | 6268000000 | 4981000000 |
Igniting the spark of knowledge
In the ever-evolving landscape of technology, NetApp, Inc. and Zebra Technologies Corporation have carved distinct paths over the past decade. From 2014 to 2023, NetApp's revenue journey reflects a steady resilience, with a peak in 2023, showing a 1% increase from the previous year. Meanwhile, Zebra Technologies experienced a remarkable growth spurt, with revenues surging by over 240% from 2014 to 2022, before a slight dip in 2023.
The data reveals a compelling narrative of adaptation and growth, underscoring the dynamic nature of the tech industry.
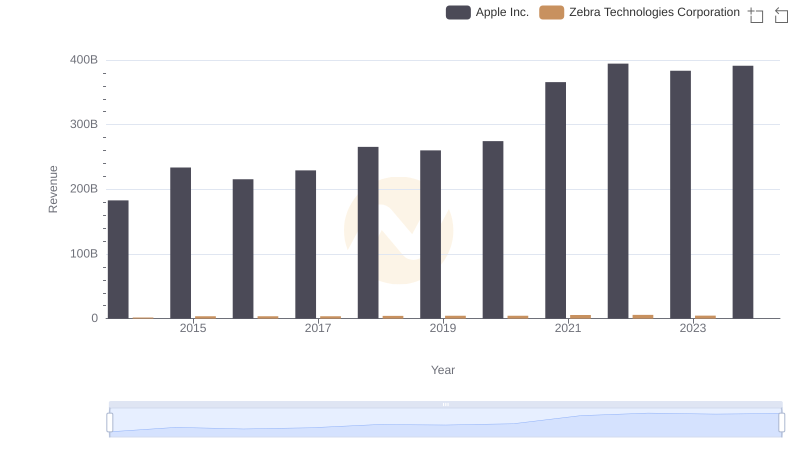
Revenue Insights: Apple Inc. and Zebra Technologies Corporation Performance Compared
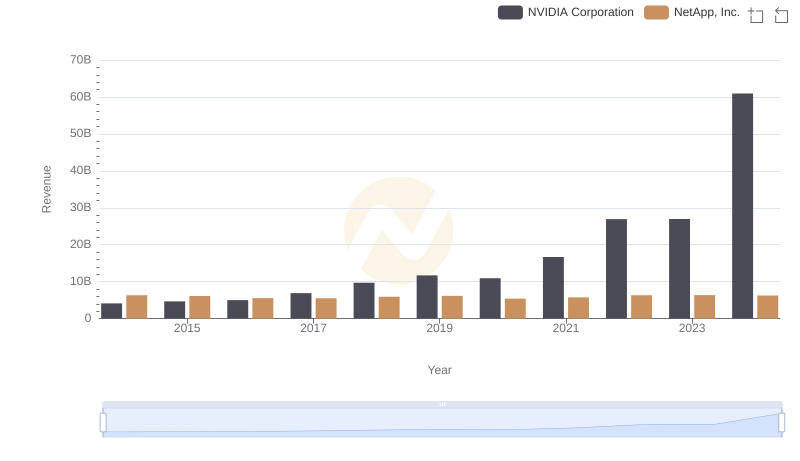
NVIDIA Corporation vs NetApp, Inc.: Examining Key Revenue Metrics
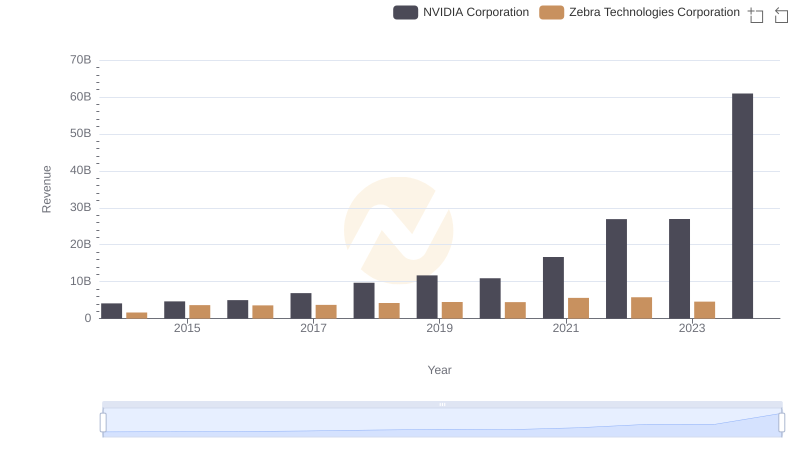
NVIDIA Corporation vs Zebra Technologies Corporation: Examining Key Revenue Metrics
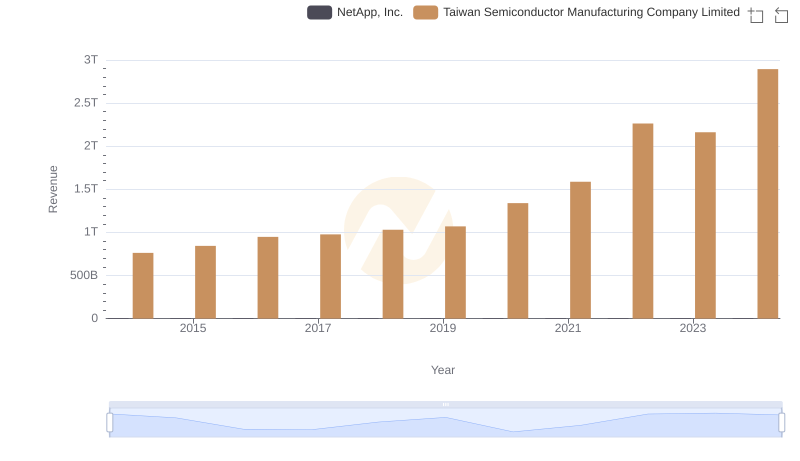
Revenue Insights: Taiwan Semiconductor Manufacturing Company Limited and NetApp, Inc. Performance Compared
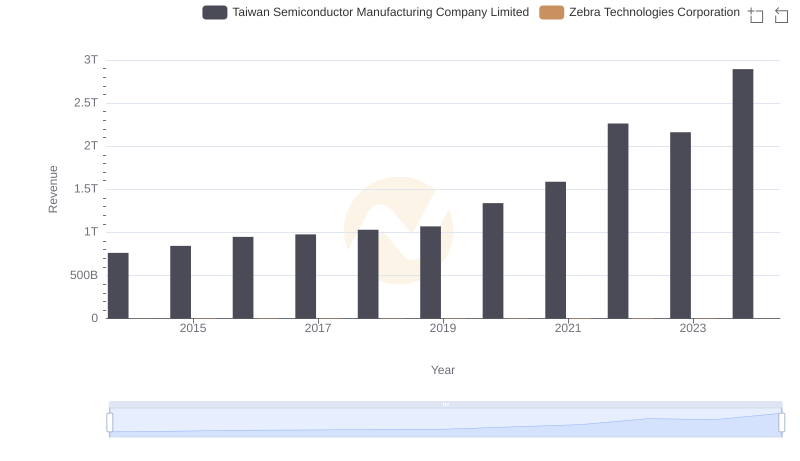
Taiwan Semiconductor Manufacturing Company Limited and Zebra Technologies Corporation: A Comprehensive Revenue Analysis
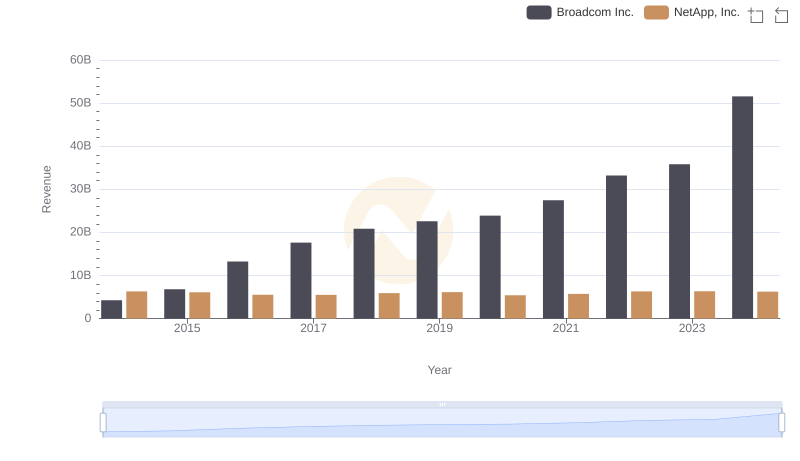
Breaking Down Revenue Trends: Broadcom Inc. vs NetApp, Inc.
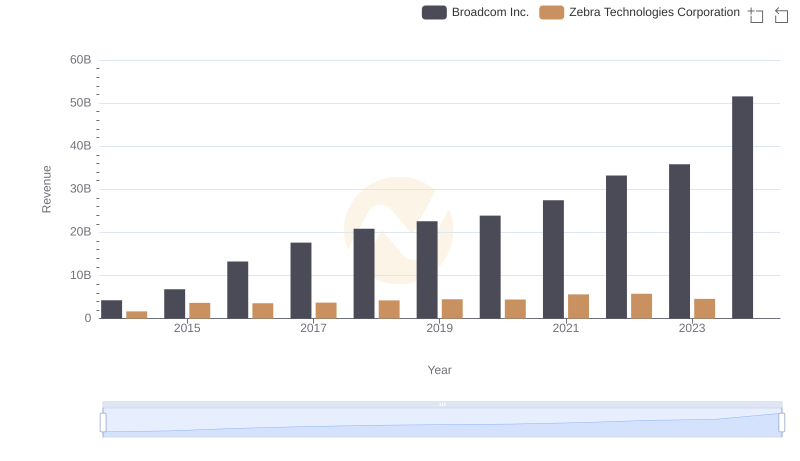
Revenue Insights: Broadcom Inc. and Zebra Technologies Corporation Performance Compared
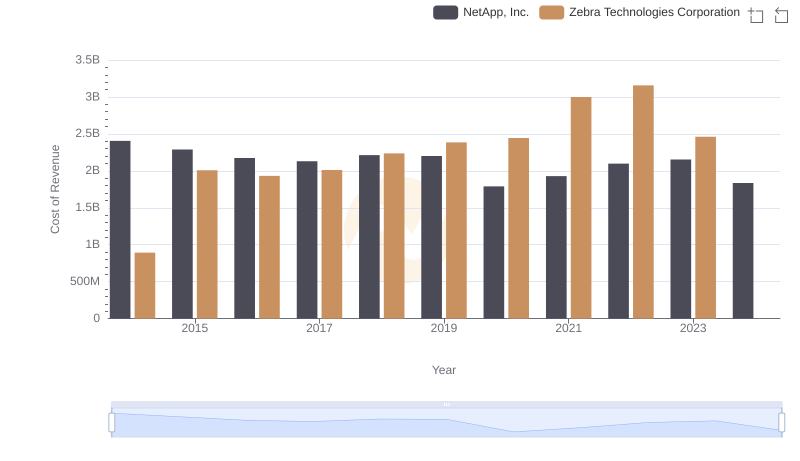
Cost of Revenue Trends: NetApp, Inc. vs Zebra Technologies Corporation
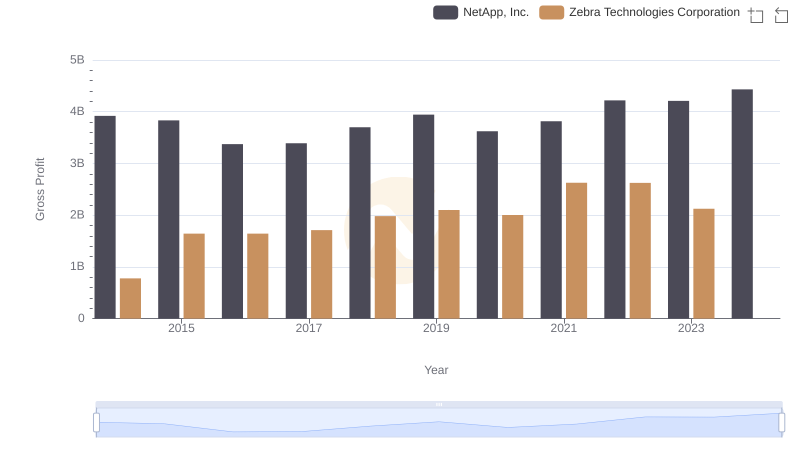
Gross Profit Analysis: Comparing NetApp, Inc. and Zebra Technologies Corporation
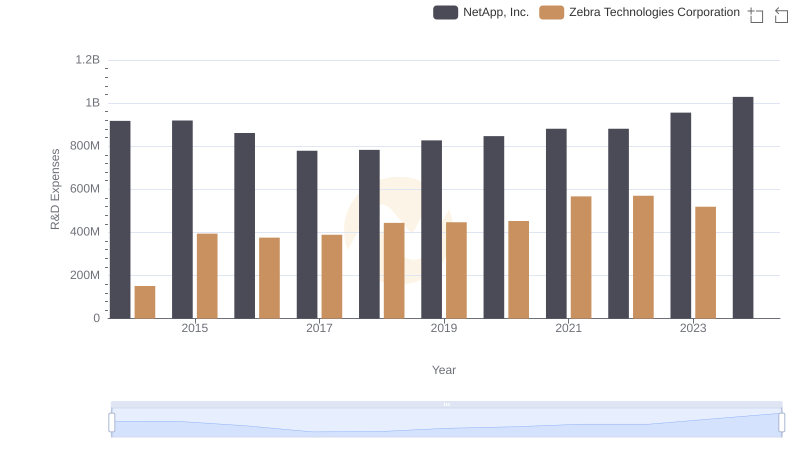
Who Prioritizes Innovation? R&D Spending Compared for NetApp, Inc. and Zebra Technologies Corporation
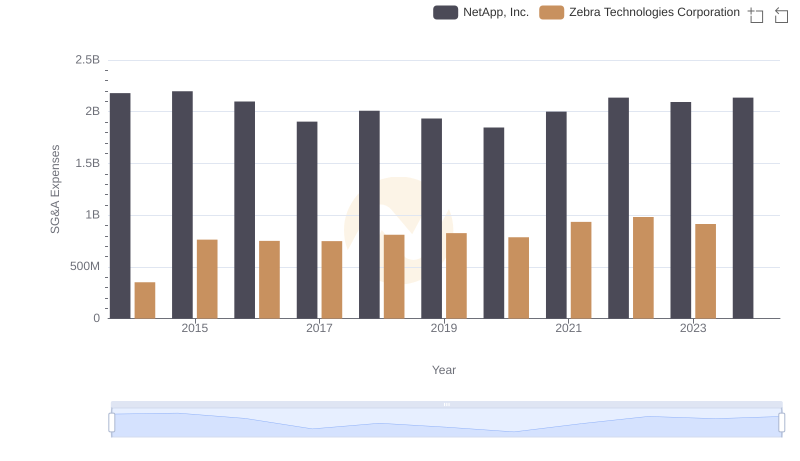
Who Optimizes SG&A Costs Better? NetApp, Inc. or Zebra Technologies Corporation
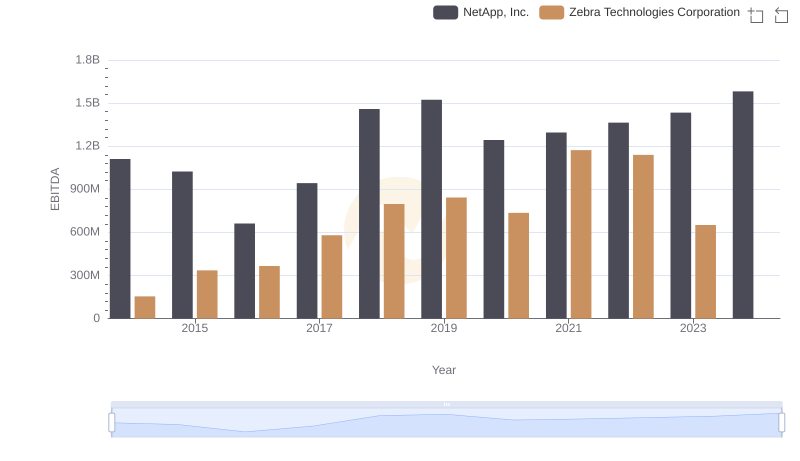
A Professional Review of EBITDA: NetApp, Inc. Compared to Zebra Technologies Corporation