| __timestamp | NetApp, Inc. | Zebra Technologies Corporation |
|---|---|---|
| Wednesday, January 1, 2014 | 1110900000 | 154836000 |
| Thursday, January 1, 2015 | 1023700000 | 336000000 |
| Friday, January 1, 2016 | 662000000 | 366000000 |
| Sunday, January 1, 2017 | 943000000 | 580000000 |
| Monday, January 1, 2018 | 1459000000 | 798000000 |
| Tuesday, January 1, 2019 | 1523000000 | 843000000 |
| Wednesday, January 1, 2020 | 1243000000 | 736000000 |
| Friday, January 1, 2021 | 1295000000 | 1173000000 |
| Saturday, January 1, 2022 | 1364000000 | 1140000000 |
| Sunday, January 1, 2023 | 1434000000 | 652000000 |
| Monday, January 1, 2024 | 1582000000 | 937000000 |
Unleashing insights
In the ever-evolving landscape of technology, understanding financial health is crucial. This analysis delves into the EBITDA performance of NetApp, Inc. and Zebra Technologies Corporation from 2014 to 2024. Over this decade, NetApp consistently outperformed Zebra Technologies, with an average EBITDA nearly double that of Zebra. Notably, NetApp's EBITDA peaked in 2024, showing a robust growth of approximately 42% from its 2014 figures. Zebra Technologies, while showing a steady increase, reached its highest EBITDA in 2021, marking a significant 658% rise from 2014. However, the data for 2024 is missing for Zebra, leaving a gap in the latest comparison. This financial journey highlights the resilience and strategic prowess of these companies in navigating market challenges. As we look to the future, these insights provide a valuable lens through which to assess potential growth trajectories.
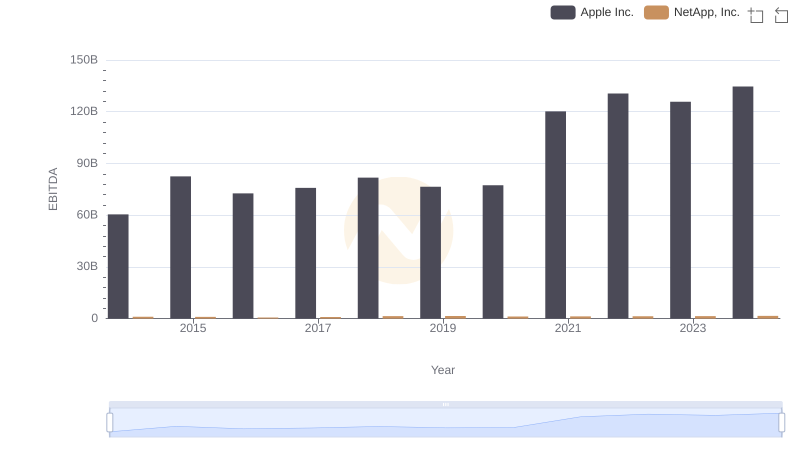
EBITDA Performance Review: Apple Inc. vs NetApp, Inc.
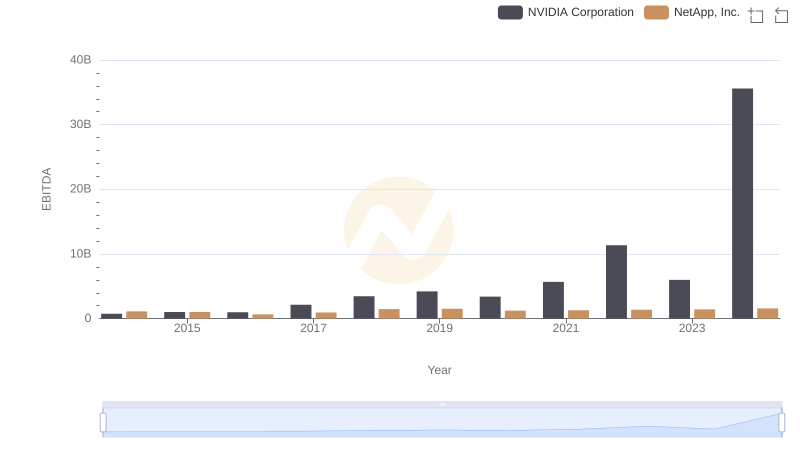
Comparative EBITDA Analysis: NVIDIA Corporation vs NetApp, Inc.
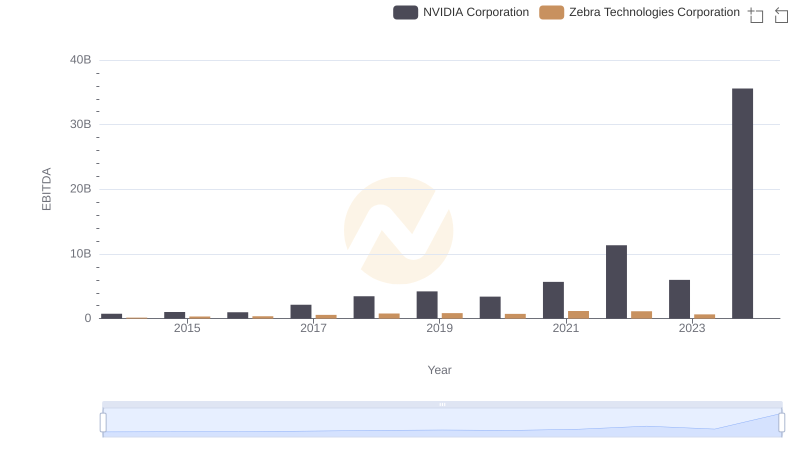
A Side-by-Side Analysis of EBITDA: NVIDIA Corporation and Zebra Technologies Corporation

EBITDA Performance Review: Taiwan Semiconductor Manufacturing Company Limited vs NetApp, Inc.
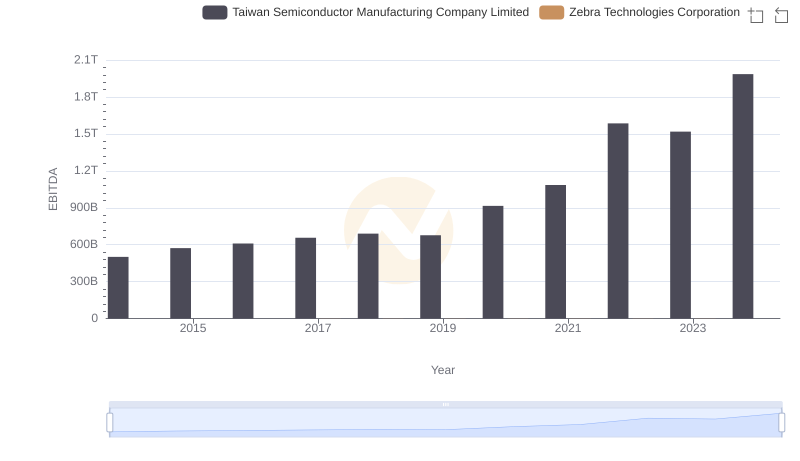
EBITDA Performance Review: Taiwan Semiconductor Manufacturing Company Limited vs Zebra Technologies Corporation
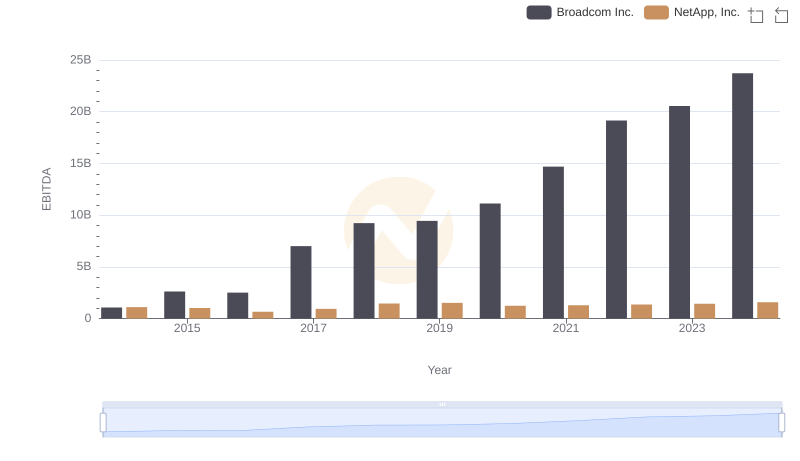
EBITDA Analysis: Evaluating Broadcom Inc. Against NetApp, Inc.
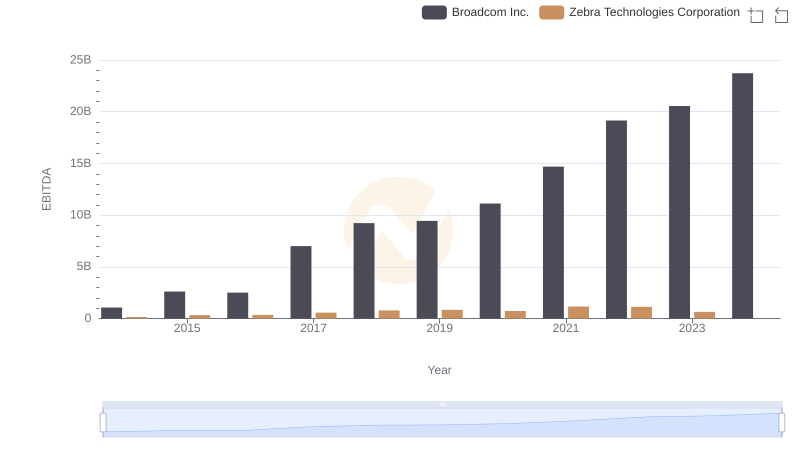
EBITDA Performance Review: Broadcom Inc. vs Zebra Technologies Corporation
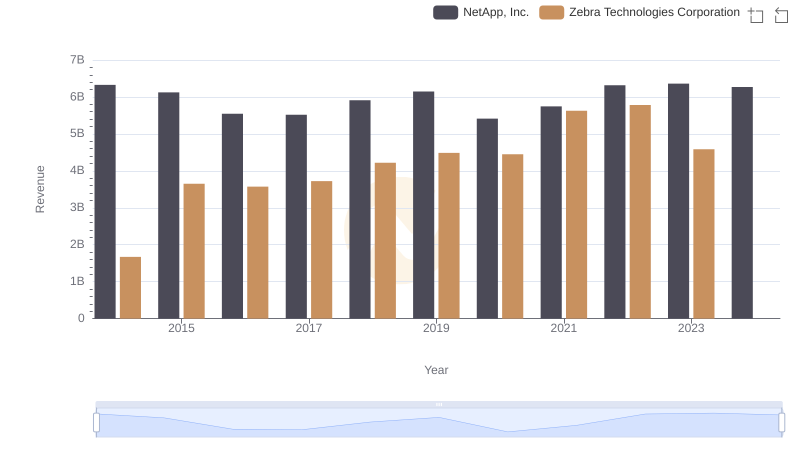
NetApp, Inc. and Zebra Technologies Corporation: A Comprehensive Revenue Analysis
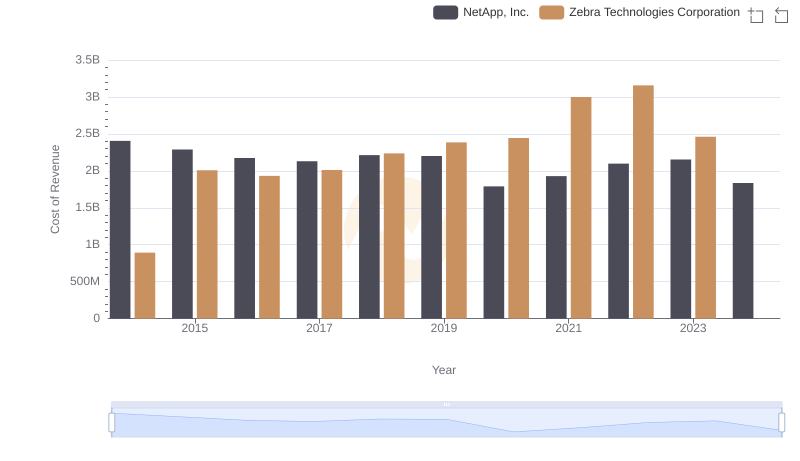
Cost of Revenue Trends: NetApp, Inc. vs Zebra Technologies Corporation
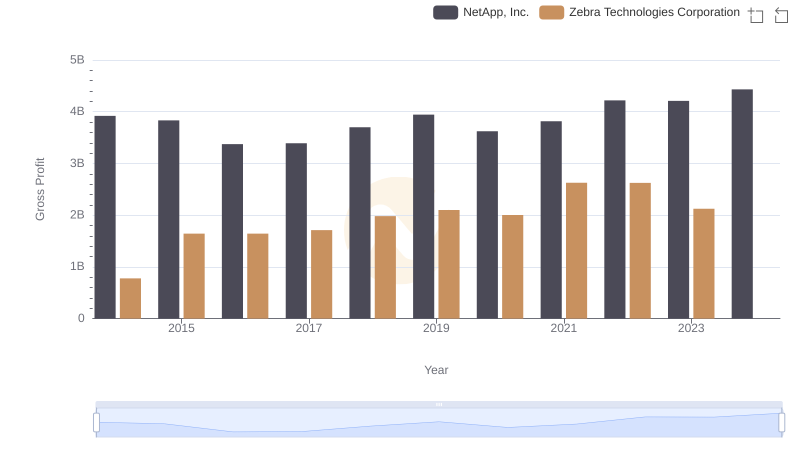
Gross Profit Analysis: Comparing NetApp, Inc. and Zebra Technologies Corporation
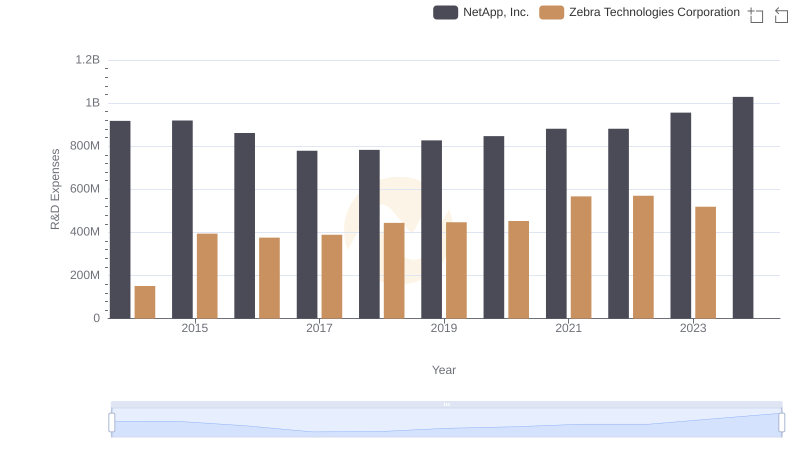
Who Prioritizes Innovation? R&D Spending Compared for NetApp, Inc. and Zebra Technologies Corporation
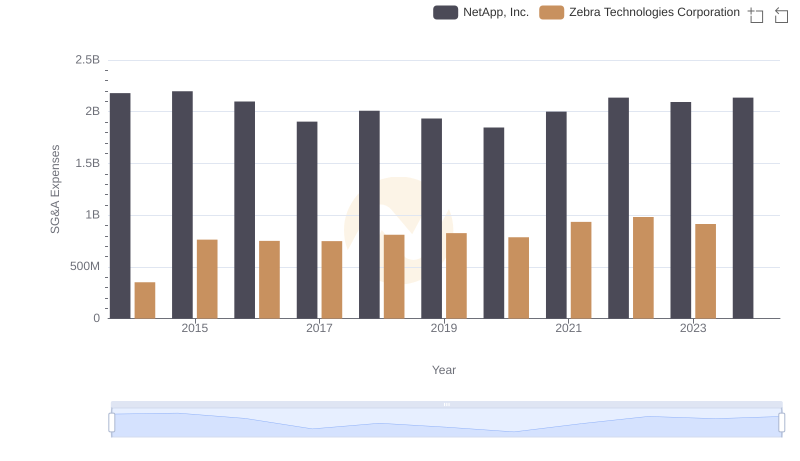
Who Optimizes SG&A Costs Better? NetApp, Inc. or Zebra Technologies Corporation