| __timestamp | NetApp, Inc. | Zebra Technologies Corporation |
|---|---|---|
| Wednesday, January 1, 2014 | 3919100000 | 778025000 |
| Thursday, January 1, 2015 | 3833200000 | 1644233000 |
| Friday, January 1, 2016 | 3373000000 | 1642000000 |
| Sunday, January 1, 2017 | 3390000000 | 1710000000 |
| Monday, January 1, 2018 | 3699000000 | 1981000000 |
| Tuesday, January 1, 2019 | 3945000000 | 2100000000 |
| Wednesday, January 1, 2020 | 3623000000 | 2003000000 |
| Friday, January 1, 2021 | 3815000000 | 2628000000 |
| Saturday, January 1, 2022 | 4220000000 | 2624000000 |
| Sunday, January 1, 2023 | 4209000000 | 2123000000 |
| Monday, January 1, 2024 | 4433000000 | 2413000000 |
Cracking the code
In the ever-evolving tech industry, understanding financial performance is crucial. Over the past decade, NetApp, Inc. and Zebra Technologies Corporation have shown distinct trajectories in their gross profit margins. From 2014 to 2023, NetApp's gross profit has consistently outperformed Zebra's, with a notable 13% increase from 2014 to 2023. In contrast, Zebra Technologies saw a remarkable 170% growth in gross profit from 2014 to 2022, highlighting its aggressive market expansion. However, data for 2024 is missing for Zebra, leaving room for speculation on its future performance. NetApp's steady growth, peaking in 2024, suggests a robust business model, while Zebra's rapid rise indicates a dynamic approach to market challenges. This analysis provides a snapshot of how these tech giants navigate financial landscapes, offering insights into their strategic directions.
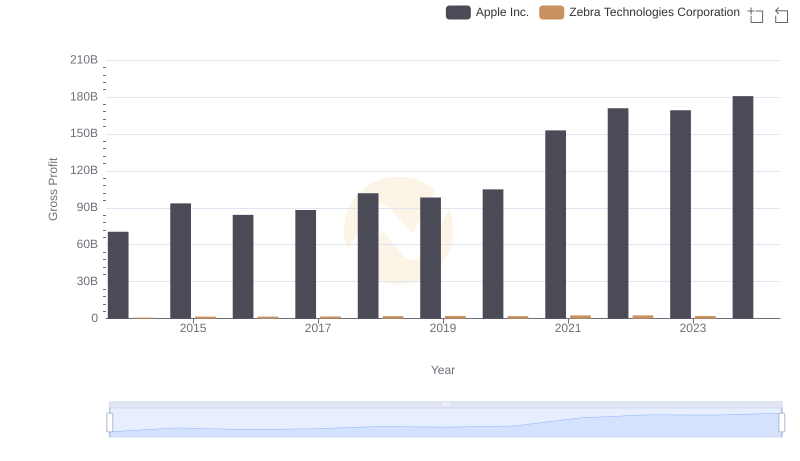
Key Insights on Gross Profit: Apple Inc. vs Zebra Technologies Corporation
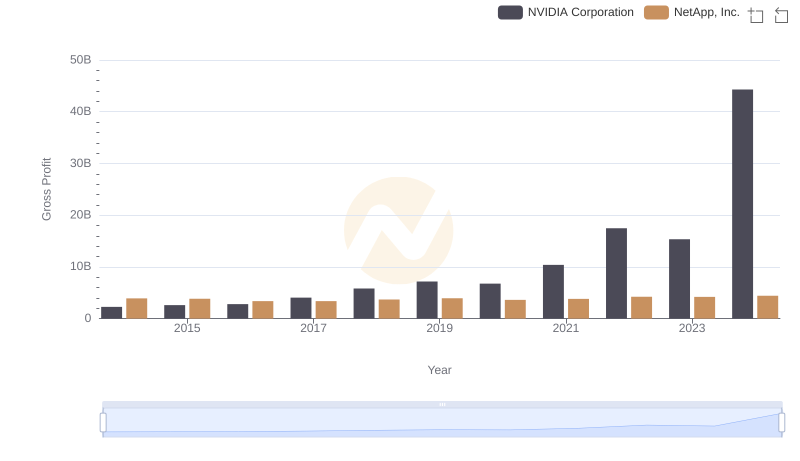
Gross Profit Comparison: NVIDIA Corporation and NetApp, Inc. Trends
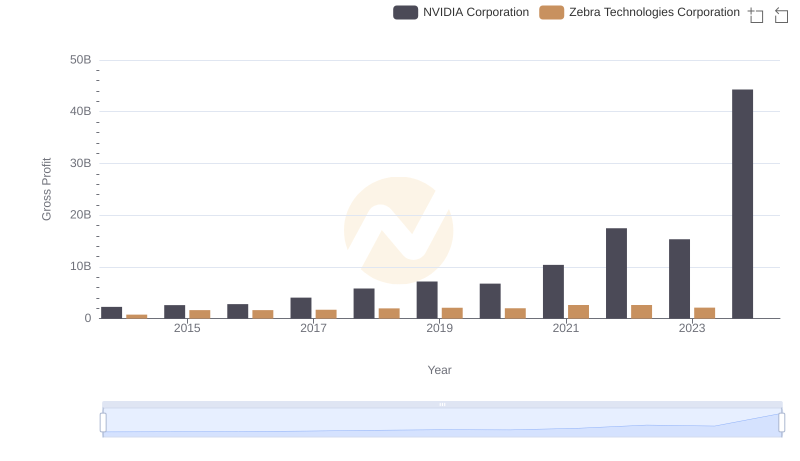
Key Insights on Gross Profit: NVIDIA Corporation vs Zebra Technologies Corporation
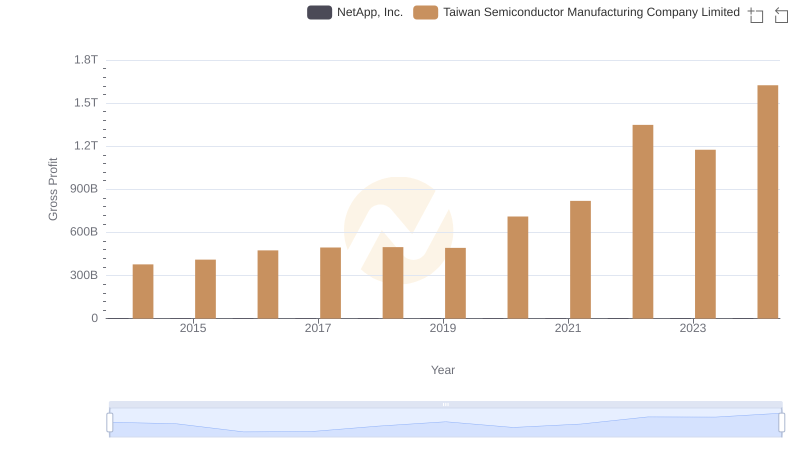
Key Insights on Gross Profit: Taiwan Semiconductor Manufacturing Company Limited vs NetApp, Inc.
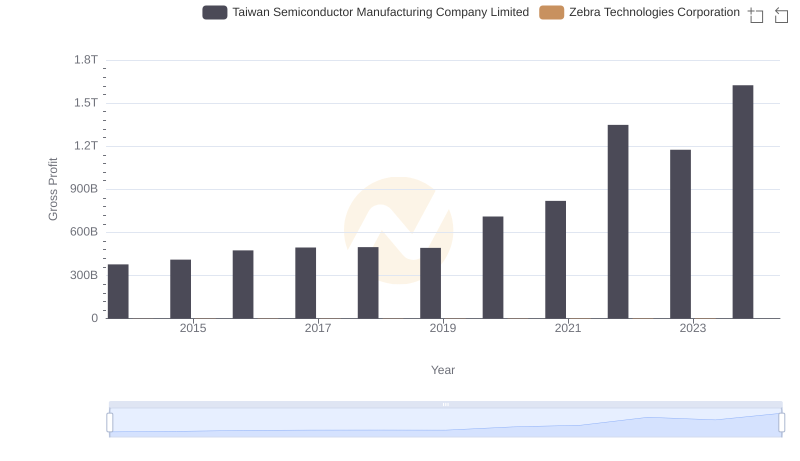
Taiwan Semiconductor Manufacturing Company Limited and Zebra Technologies Corporation: A Detailed Gross Profit Analysis
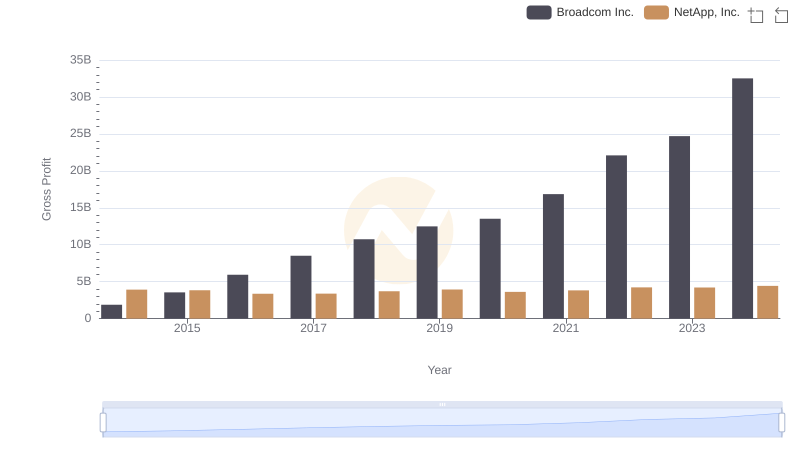
Gross Profit Analysis: Comparing Broadcom Inc. and NetApp, Inc.
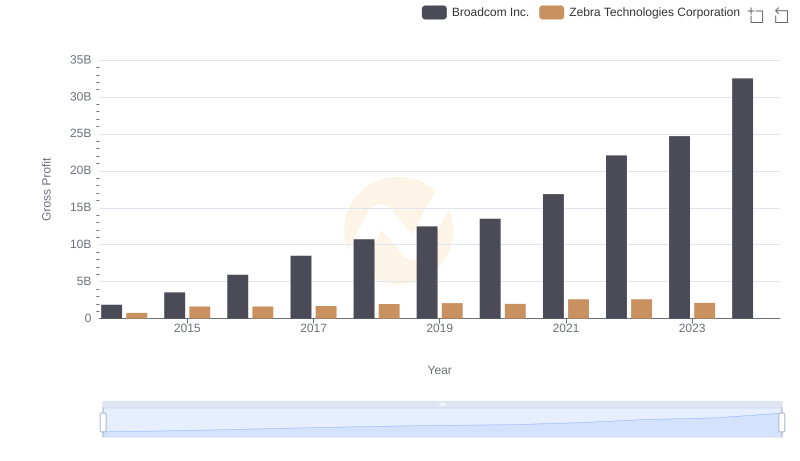
Key Insights on Gross Profit: Broadcom Inc. vs Zebra Technologies Corporation
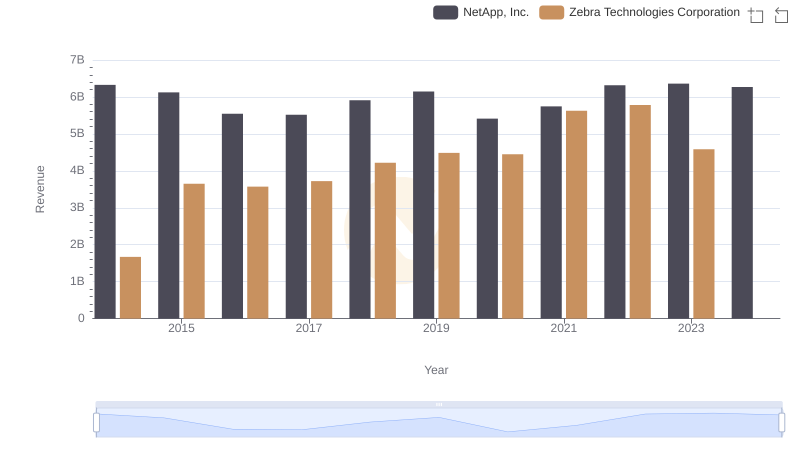
NetApp, Inc. and Zebra Technologies Corporation: A Comprehensive Revenue Analysis
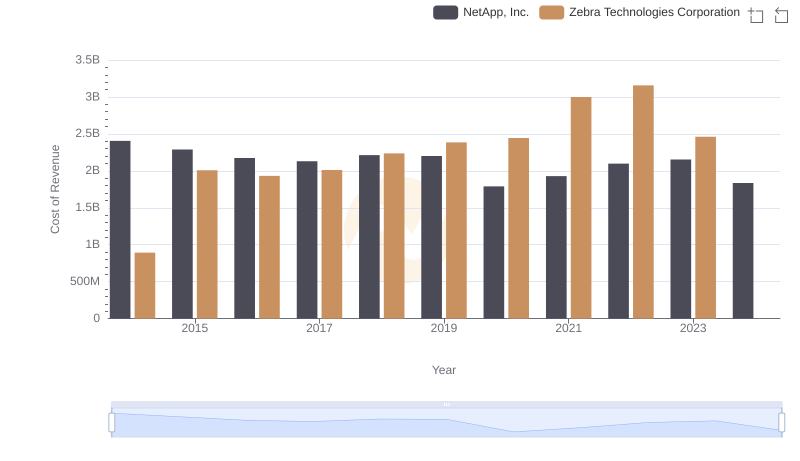
Cost of Revenue Trends: NetApp, Inc. vs Zebra Technologies Corporation
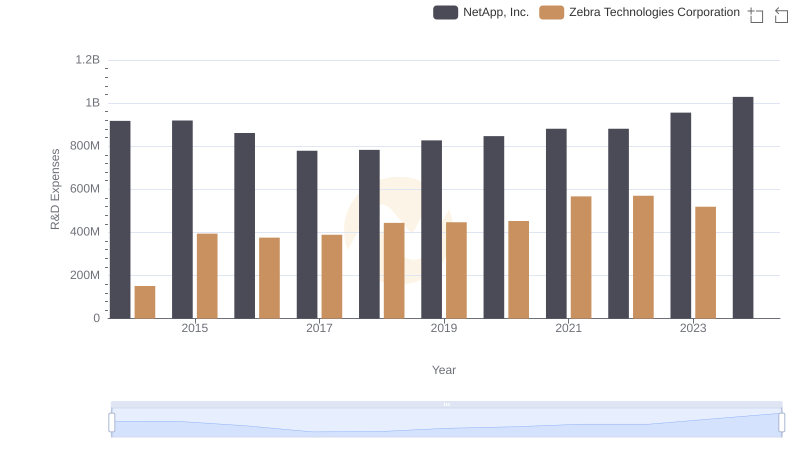
Who Prioritizes Innovation? R&D Spending Compared for NetApp, Inc. and Zebra Technologies Corporation
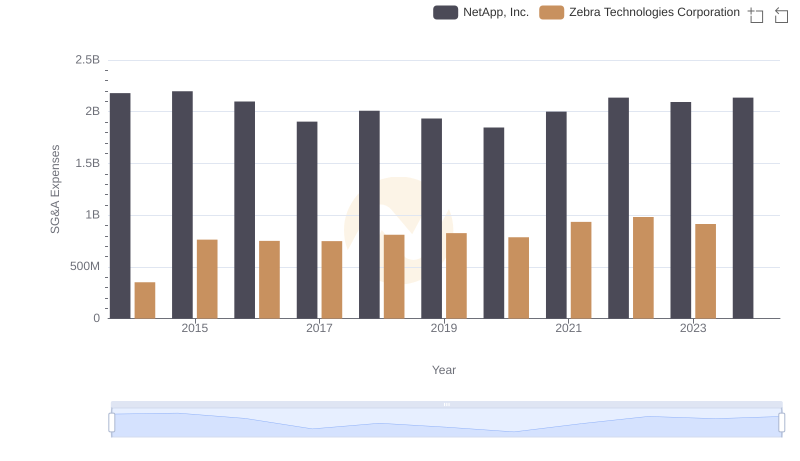
Who Optimizes SG&A Costs Better? NetApp, Inc. or Zebra Technologies Corporation
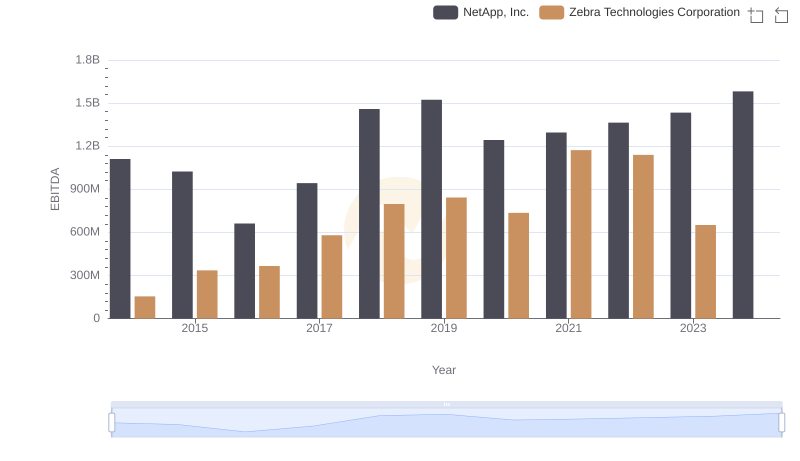
A Professional Review of EBITDA: NetApp, Inc. Compared to Zebra Technologies Corporation