| __timestamp | NetApp, Inc. | Zebra Technologies Corporation |
|---|---|---|
| Wednesday, January 1, 2014 | 2406000000 | 892547000 |
| Thursday, January 1, 2015 | 2289500000 | 2007739000 |
| Friday, January 1, 2016 | 2173000000 | 1932000000 |
| Sunday, January 1, 2017 | 2129000000 | 2012000000 |
| Monday, January 1, 2018 | 2212000000 | 2237000000 |
| Tuesday, January 1, 2019 | 2201000000 | 2385000000 |
| Wednesday, January 1, 2020 | 1789000000 | 2445000000 |
| Friday, January 1, 2021 | 1929000000 | 2999000000 |
| Saturday, January 1, 2022 | 2098000000 | 3157000000 |
| Sunday, January 1, 2023 | 2153000000 | 2461000000 |
| Monday, January 1, 2024 | 1835000000 | 2568000000 |
Cracking the code
In the ever-evolving landscape of technology, understanding cost dynamics is crucial. This chart delves into the cost of revenue trends for NetApp, Inc. and Zebra Technologies Corporation from 2014 to 2024. NetApp, a leader in data management, saw its cost of revenue peak in 2014, followed by a gradual decline, reaching approximately 76% of its 2014 value by 2024. Zebra Technologies, known for its innovative enterprise solutions, experienced a different trajectory. Starting with a lower cost of revenue in 2014, Zebra's costs surged, peaking in 2022 at over 350% of its 2014 figure, before slightly declining in 2023. This divergence highlights the distinct strategic paths these companies have taken. While NetApp focuses on efficiency, Zebra's growth strategy has led to increased costs. Missing data for Zebra in 2024 suggests a potential shift or recalibration in their financial reporting.
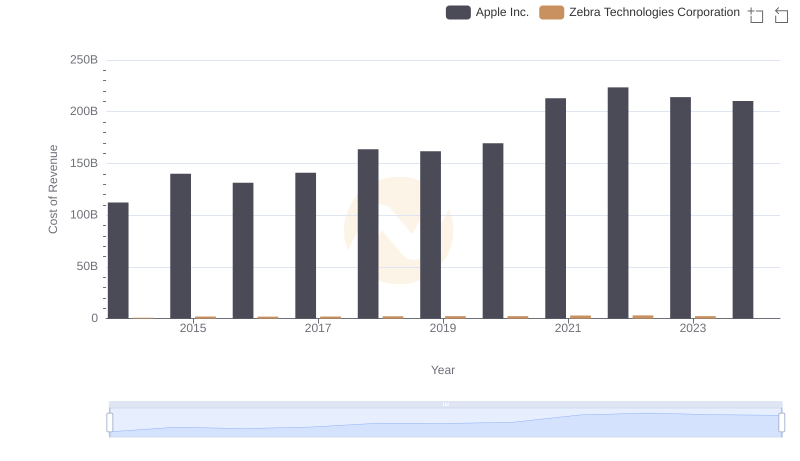
Apple Inc. vs Zebra Technologies Corporation: Efficiency in Cost of Revenue Explored
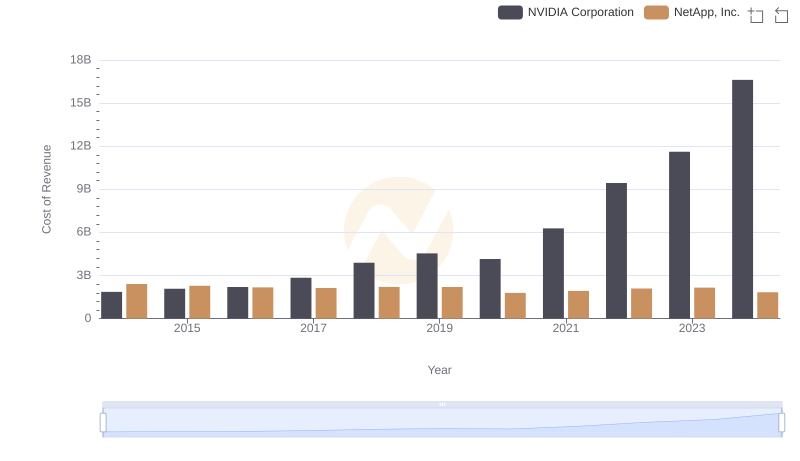
Cost Insights: Breaking Down NVIDIA Corporation and NetApp, Inc.'s Expenses
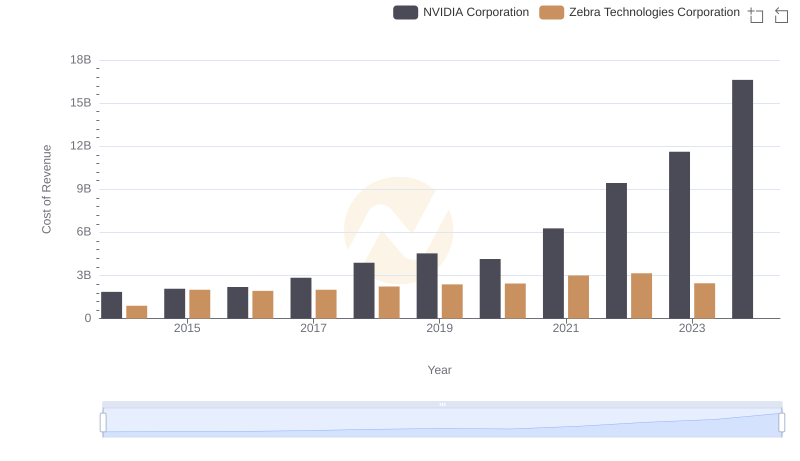
Cost of Revenue: Key Insights for NVIDIA Corporation and Zebra Technologies Corporation
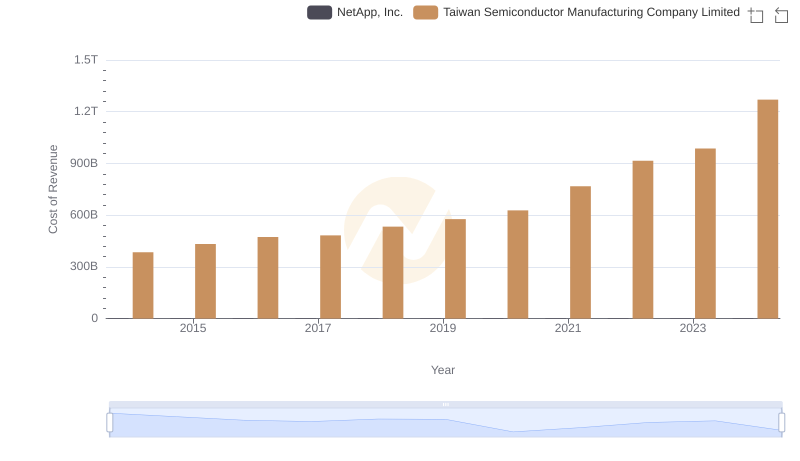
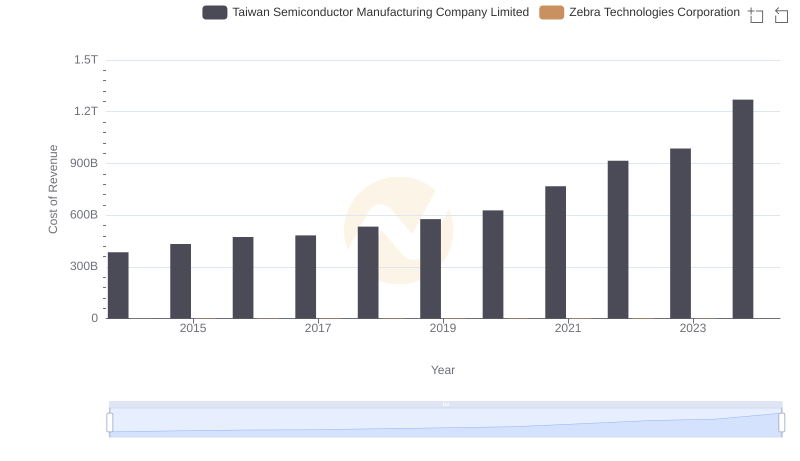
Cost of Revenue Trends: Taiwan Semiconductor Manufacturing Company Limited vs NetApp, Inc.
Cost of Revenue: Key Insights for Taiwan Semiconductor Manufacturing Company Limited and Zebra Technologies Corporation
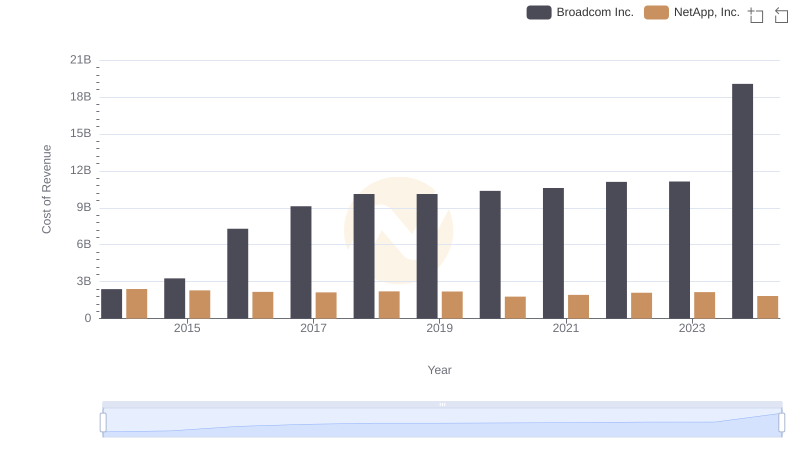
Comparing Cost of Revenue Efficiency: Broadcom Inc. vs NetApp, Inc.
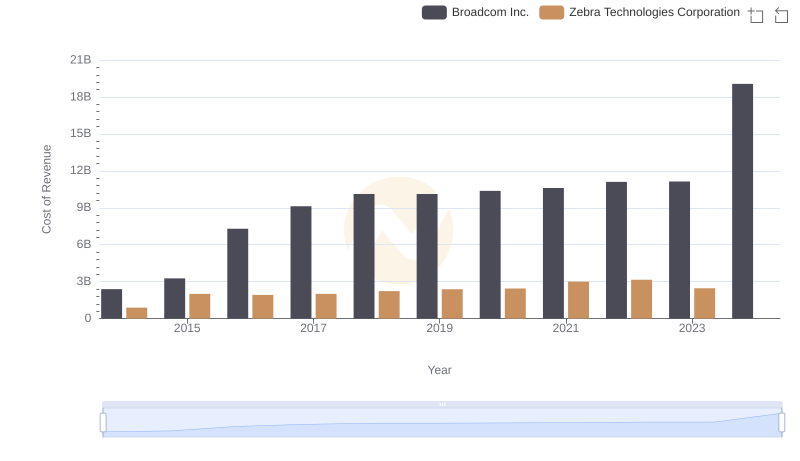
Broadcom Inc. vs Zebra Technologies Corporation: Efficiency in Cost of Revenue Explored
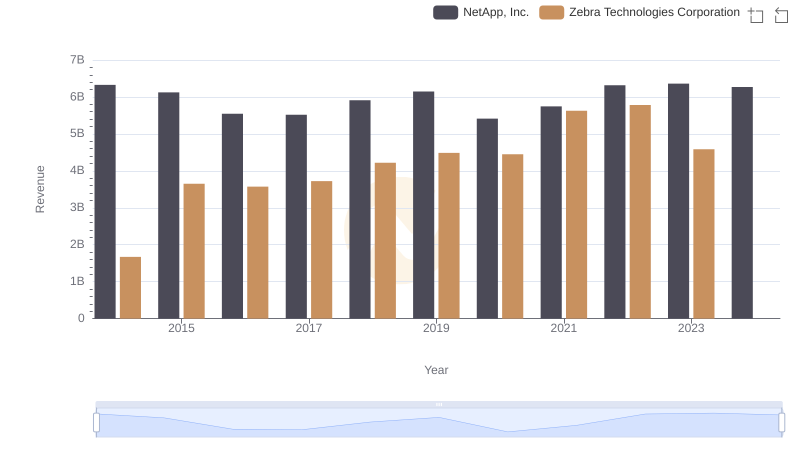
NetApp, Inc. and Zebra Technologies Corporation: A Comprehensive Revenue Analysis
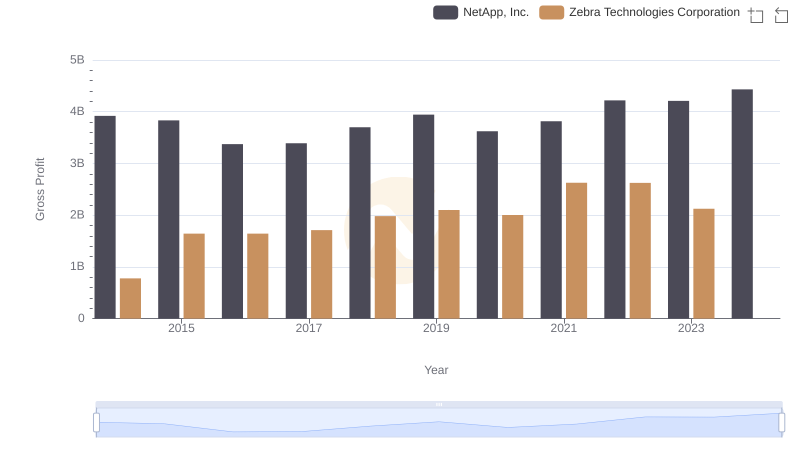
Gross Profit Analysis: Comparing NetApp, Inc. and Zebra Technologies Corporation
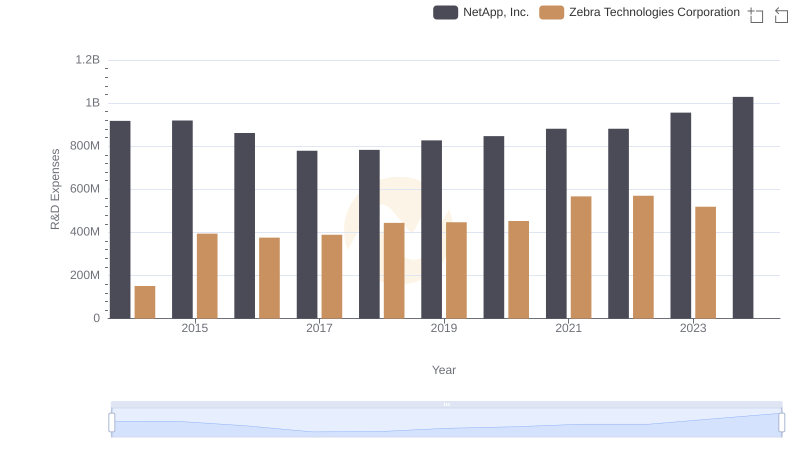
Who Prioritizes Innovation? R&D Spending Compared for NetApp, Inc. and Zebra Technologies Corporation
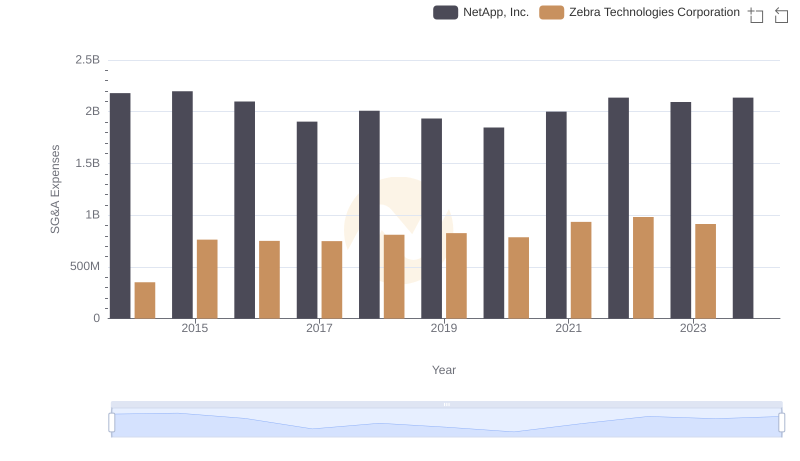
Who Optimizes SG&A Costs Better? NetApp, Inc. or Zebra Technologies Corporation
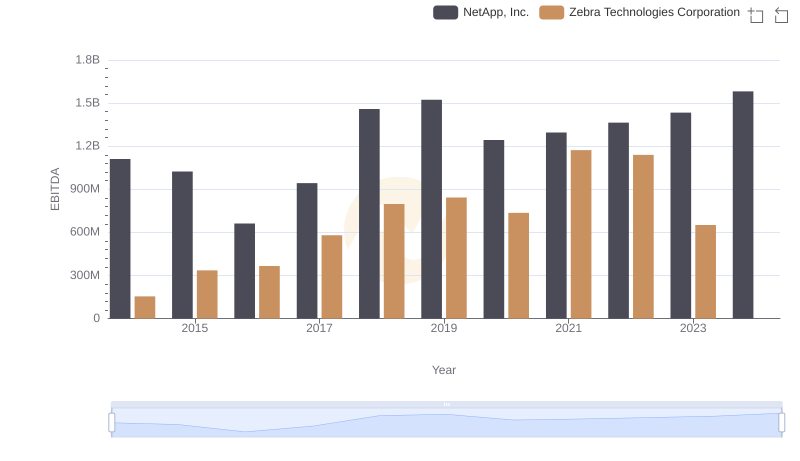
A Professional Review of EBITDA: NetApp, Inc. Compared to Zebra Technologies Corporation