| __timestamp | Gartner, Inc. | Splunk Inc. |
|---|---|---|
| Wednesday, January 1, 2014 | 1223508000 | 266798000 |
| Thursday, January 1, 2015 | 1323980000 | 382497000 |
| Friday, January 1, 2016 | 1498892000 | 554313000 |
| Sunday, January 1, 2017 | 1991296000 | 758902000 |
| Monday, January 1, 2018 | 2506654000 | 1014379000 |
| Tuesday, January 1, 2019 | 2694753000 | 1458334000 |
| Wednesday, January 1, 2020 | 2754348000 | 1929138000 |
| Friday, January 1, 2021 | 3289833000 | 1682040000 |
| Saturday, January 1, 2022 | 3782024000 | 1939695000 |
| Sunday, January 1, 2023 | 4003716000 | 2837713000 |
| Monday, January 1, 2024 | 6267411000 | 3350088000 |
Unleashing the power of data
In the ever-evolving landscape of technology, financial performance is a key indicator of a company's resilience and adaptability. Over the past decade, Gartner, Inc. and Splunk Inc. have demonstrated remarkable growth in gross profit, reflecting their strategic prowess in the industry.
From 2014 to 2023, Gartner, Inc. saw its gross profit soar by over 227%, peaking at approximately $4 billion in 2023. This growth underscores Gartner's ability to leverage its market insights and expand its influence. Meanwhile, Splunk Inc. experienced an impressive 963% increase, reaching nearly $2.8 billion in 2023, highlighting its rapid expansion in data analytics and software solutions.
While Gartner consistently outperformed Splunk in absolute terms, the latter's growth trajectory is noteworthy, suggesting a promising future. However, data for 2024 remains incomplete, leaving room for speculation on the continuation of these trends.
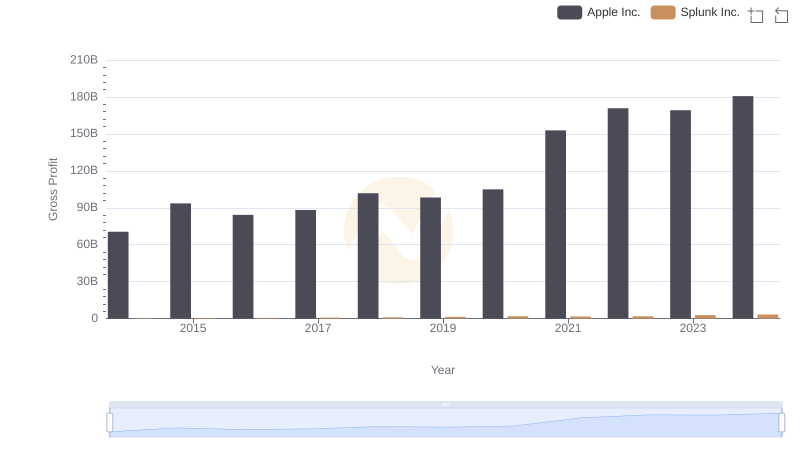
Gross Profit Analysis: Comparing Apple Inc. and Splunk Inc.
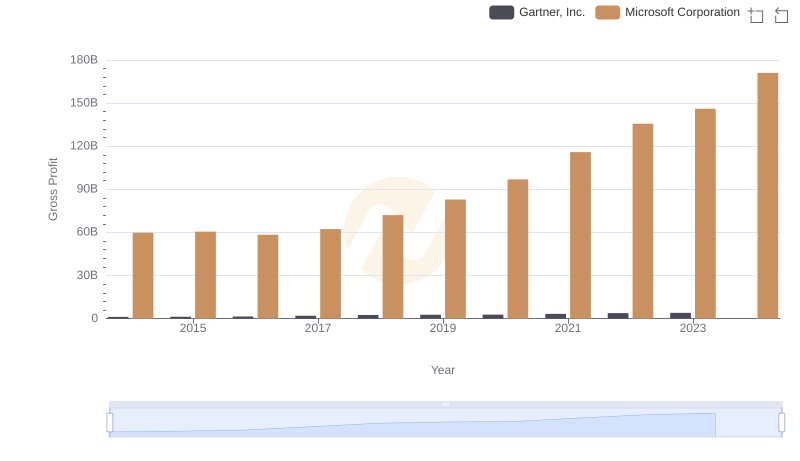
Key Insights on Gross Profit: Microsoft Corporation vs Gartner, Inc.
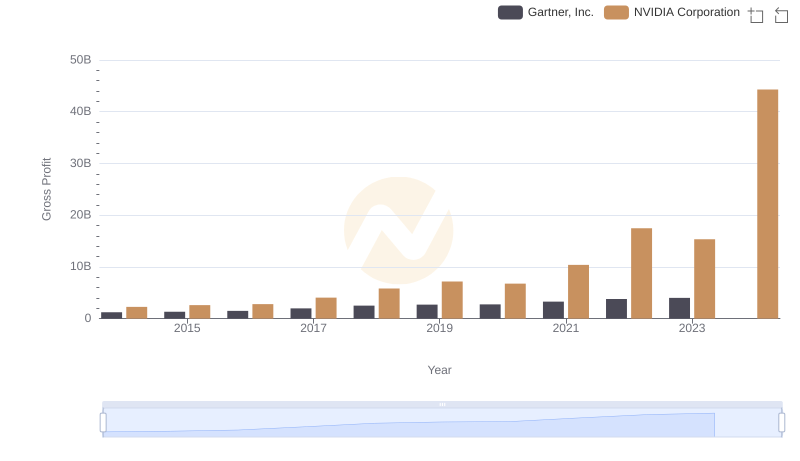
Gross Profit Comparison: NVIDIA Corporation and Gartner, Inc. Trends
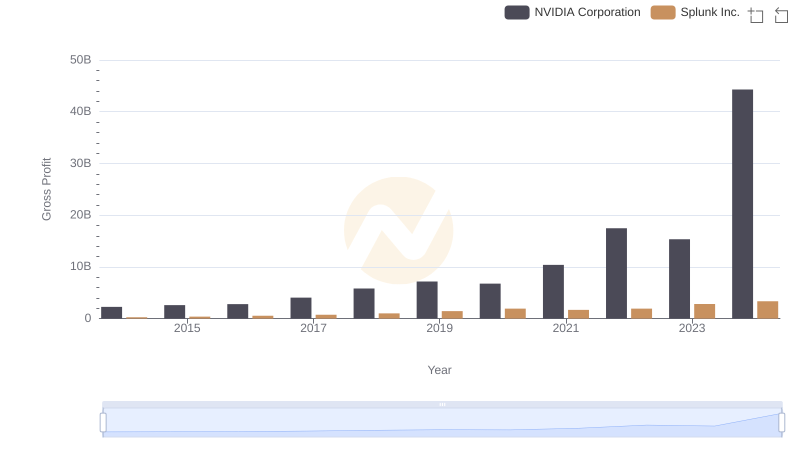
Gross Profit Analysis: Comparing NVIDIA Corporation and Splunk Inc.
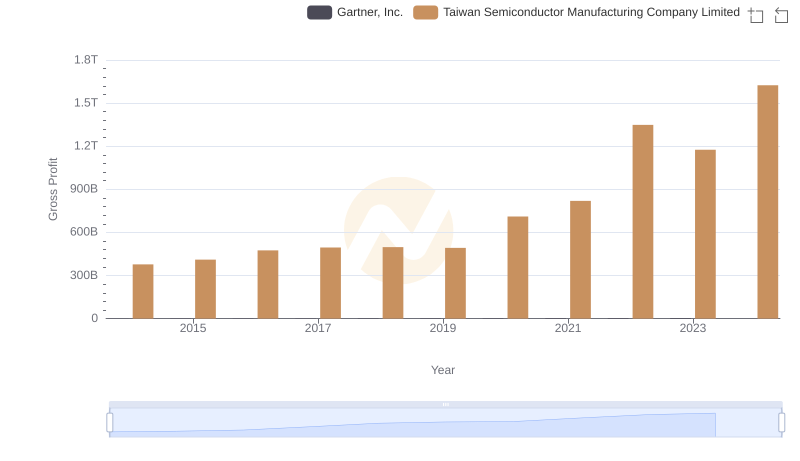
Taiwan Semiconductor Manufacturing Company Limited vs Gartner, Inc.: A Gross Profit Performance Breakdown
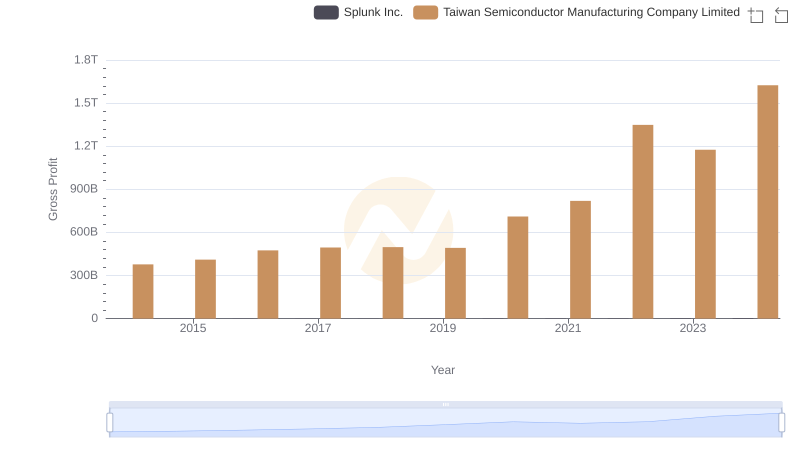
Who Generates Higher Gross Profit? Taiwan Semiconductor Manufacturing Company Limited or Splunk Inc.
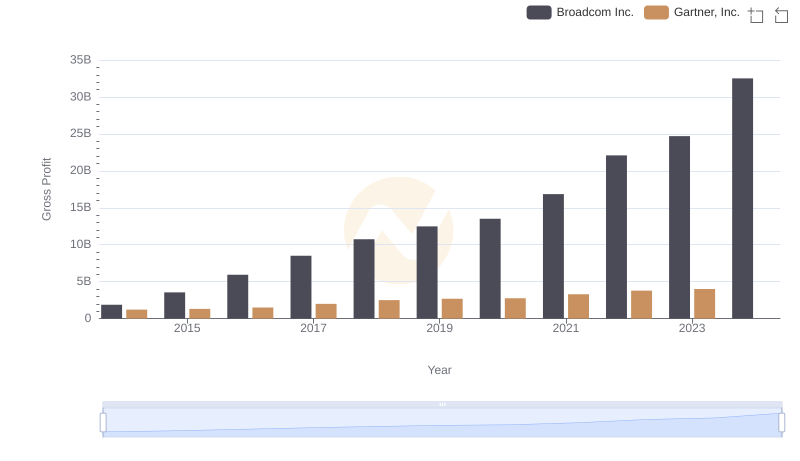
Key Insights on Gross Profit: Broadcom Inc. vs Gartner, Inc.
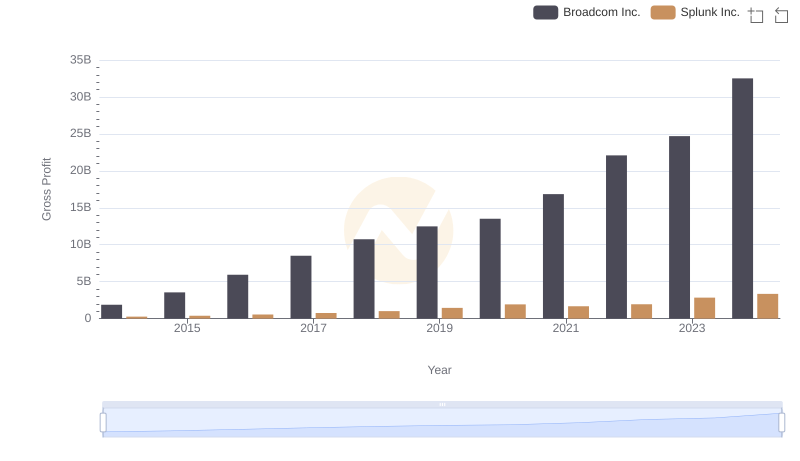
Broadcom Inc. and Splunk Inc.: A Detailed Gross Profit Analysis
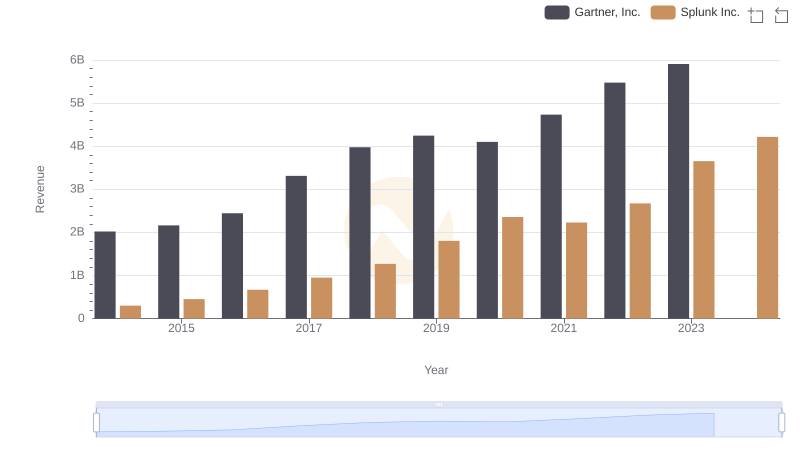
Gartner, Inc. and Splunk Inc.: A Comprehensive Revenue Analysis
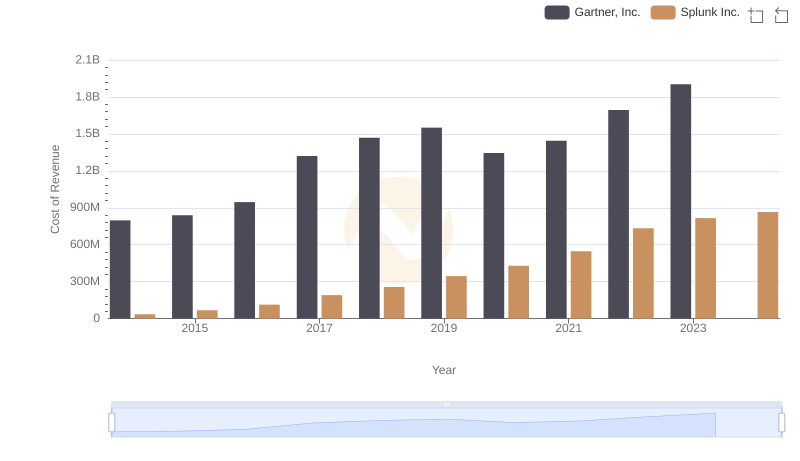
Analyzing Cost of Revenue: Gartner, Inc. and Splunk Inc.
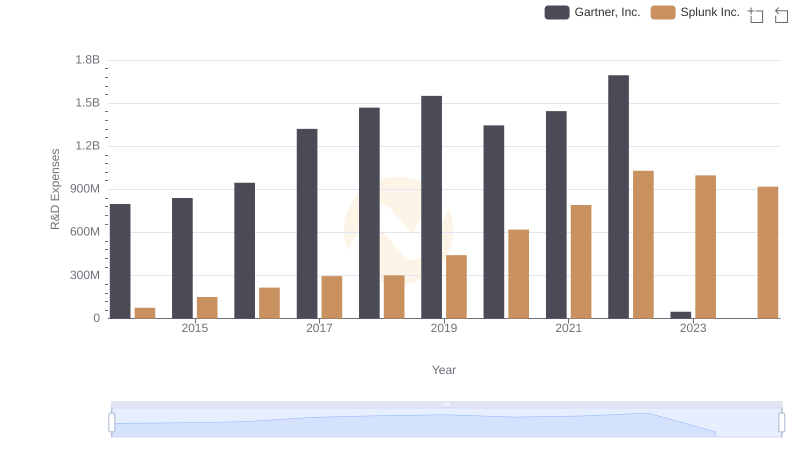
Analyzing R&D Budgets: Gartner, Inc. vs Splunk Inc.
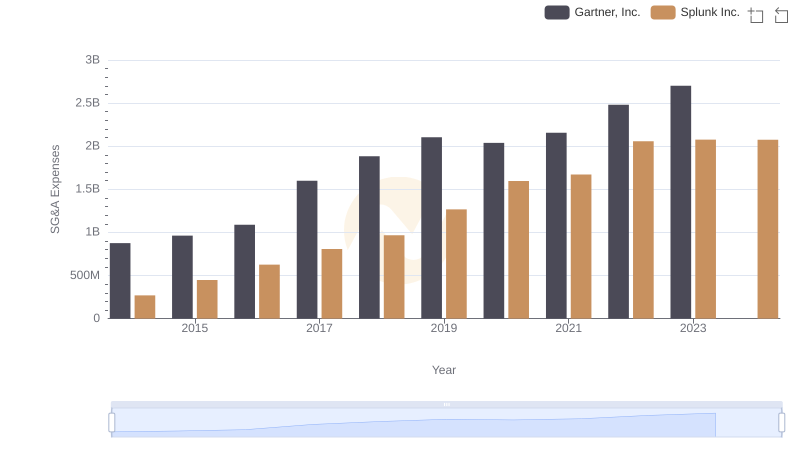
Gartner, Inc. vs Splunk Inc.: SG&A Expense Trends