| __timestamp | Gartner, Inc. | Splunk Inc. |
|---|---|---|
| Wednesday, January 1, 2014 | 2021441000 | 302623000 |
| Thursday, January 1, 2015 | 2163056000 | 450875000 |
| Friday, January 1, 2016 | 2444540000 | 668435000 |
| Sunday, January 1, 2017 | 3311494000 | 949955000 |
| Monday, January 1, 2018 | 3975454000 | 1270788000 |
| Tuesday, January 1, 2019 | 4245321000 | 1803010000 |
| Wednesday, January 1, 2020 | 4099444000 | 2358926000 |
| Friday, January 1, 2021 | 4733939000 | 2229385000 |
| Saturday, January 1, 2022 | 5475829000 | 2673664000 |
| Sunday, January 1, 2023 | 5906956000 | 3653708000 |
| Monday, January 1, 2024 | 6267411000 | 4215595000 |
Cracking the code
In the ever-evolving landscape of technology and data analytics, Gartner, Inc. and Splunk Inc. have emerged as key players. Over the past decade, Gartner's revenue has surged by approximately 192%, starting from $2 billion in 2014 to nearly $5.9 billion in 2023. This growth underscores Gartner's pivotal role in providing research and advisory services to businesses worldwide.
Conversely, Splunk Inc., a leader in data analytics, has experienced an impressive revenue increase of over 1,200% from 2014 to 2023, reaching $3.7 billion. This remarkable growth trajectory highlights Splunk's expanding influence in the realm of big data and machine learning.
While Gartner's revenue consistently outpaced Splunk's, the latter's rapid growth rate is noteworthy. The data for 2024 is incomplete, but the trends suggest continued expansion for both companies. This analysis offers a glimpse into the dynamic shifts within the tech industry over the past decade.
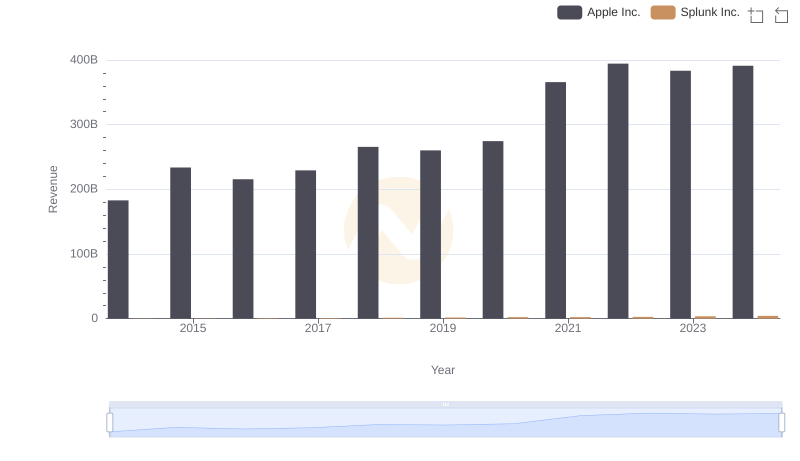
Revenue Insights: Apple Inc. and Splunk Inc. Performance Compared
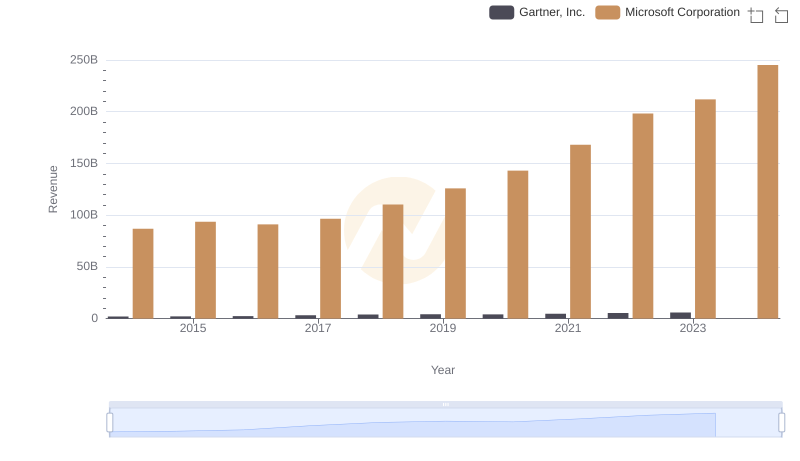
Microsoft Corporation or Gartner, Inc.: Who Leads in Yearly Revenue?
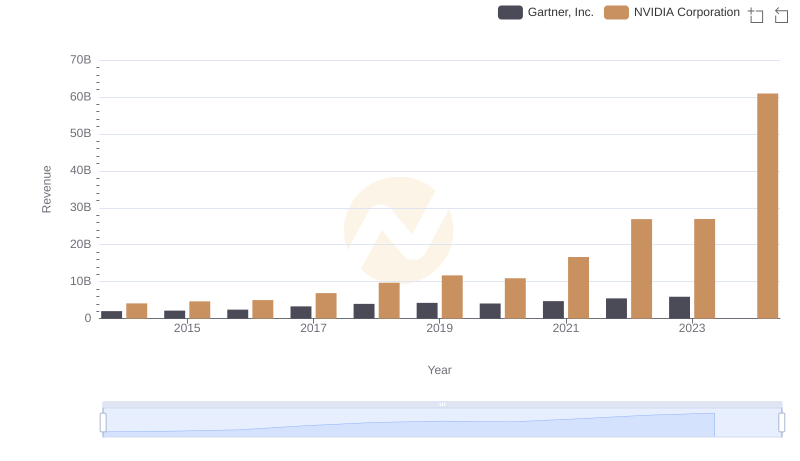
Revenue Showdown: NVIDIA Corporation vs Gartner, Inc.
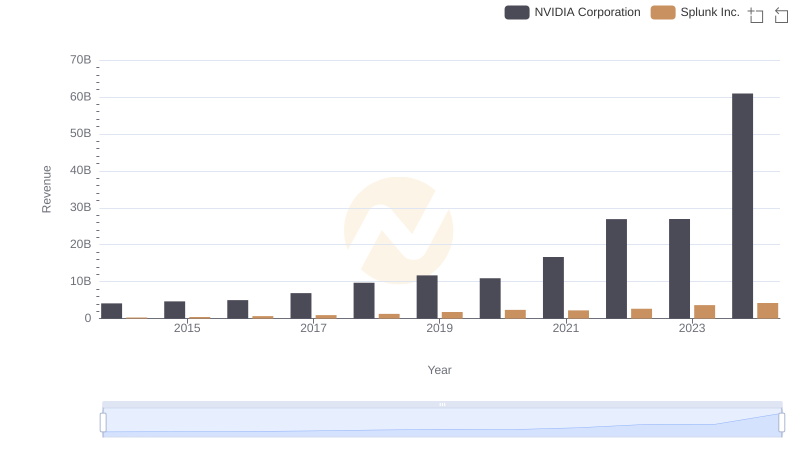
Who Generates More Revenue? NVIDIA Corporation or Splunk Inc.

Revenue Showdown: Taiwan Semiconductor Manufacturing Company Limited vs Gartner, Inc.
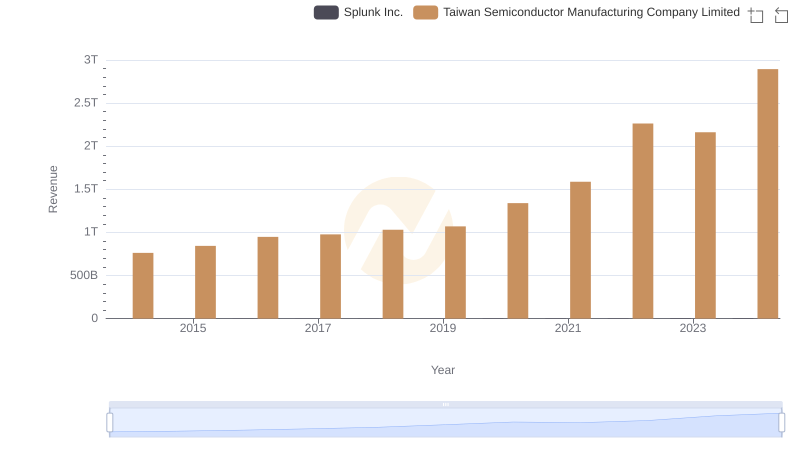
Revenue Insights: Taiwan Semiconductor Manufacturing Company Limited and Splunk Inc. Performance Compared
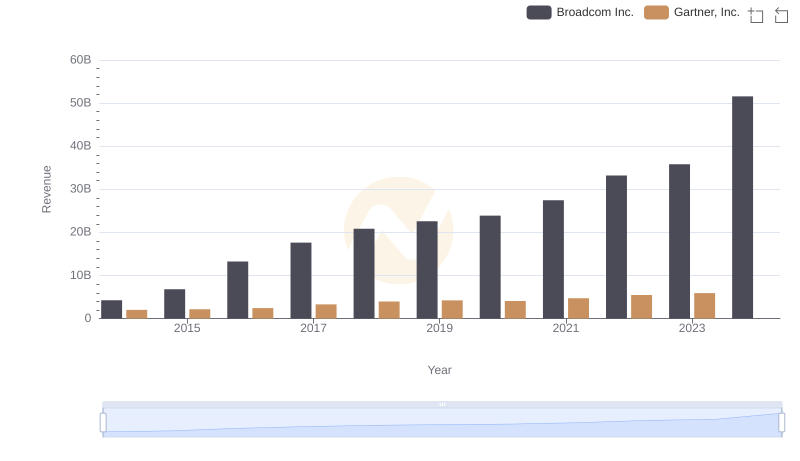
Revenue Showdown: Broadcom Inc. vs Gartner, Inc.
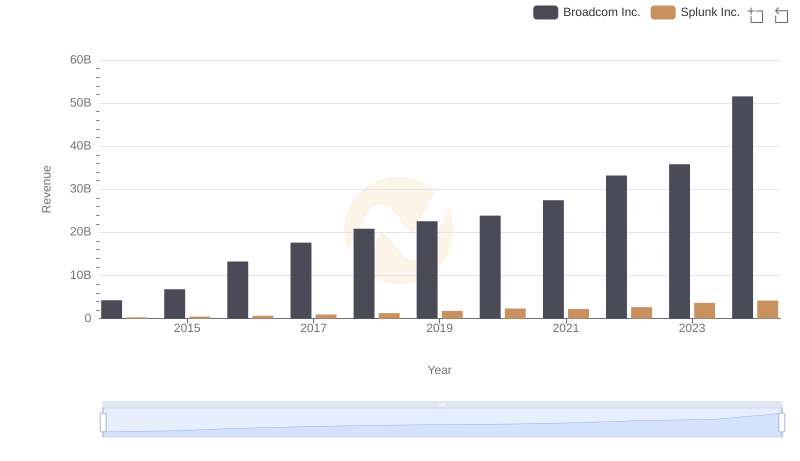
Broadcom Inc. and Splunk Inc.: A Comprehensive Revenue Analysis
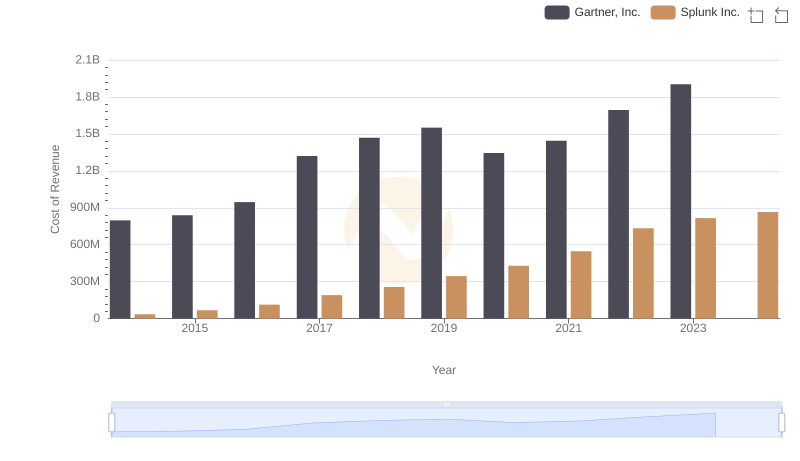
Analyzing Cost of Revenue: Gartner, Inc. and Splunk Inc.
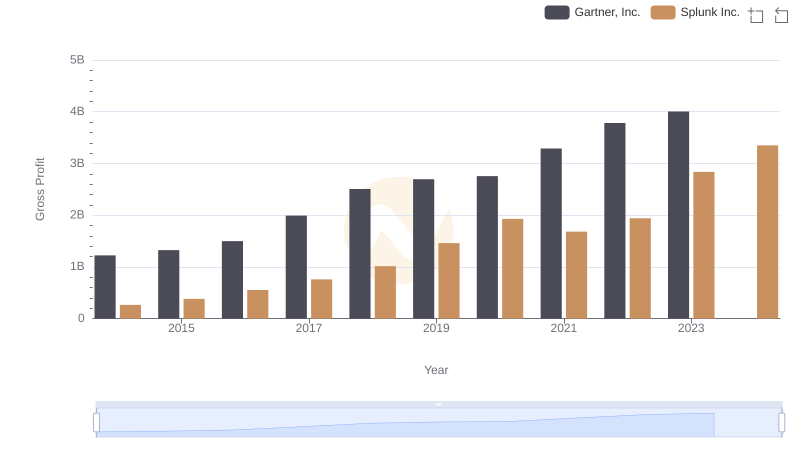
Key Insights on Gross Profit: Gartner, Inc. vs Splunk Inc.
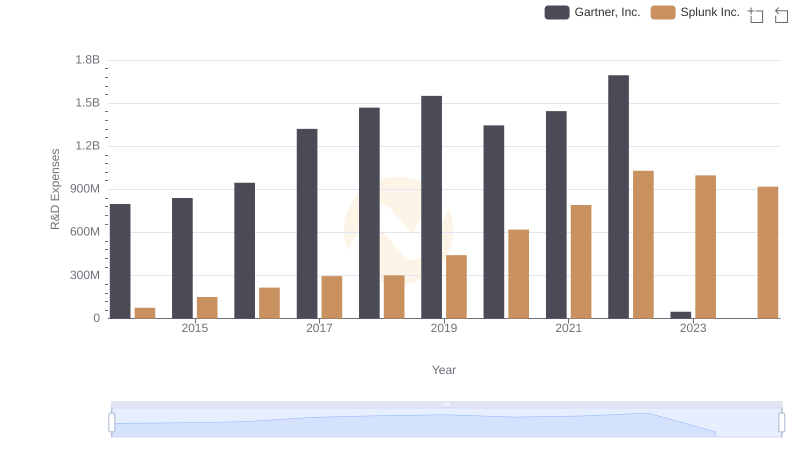
Analyzing R&D Budgets: Gartner, Inc. vs Splunk Inc.
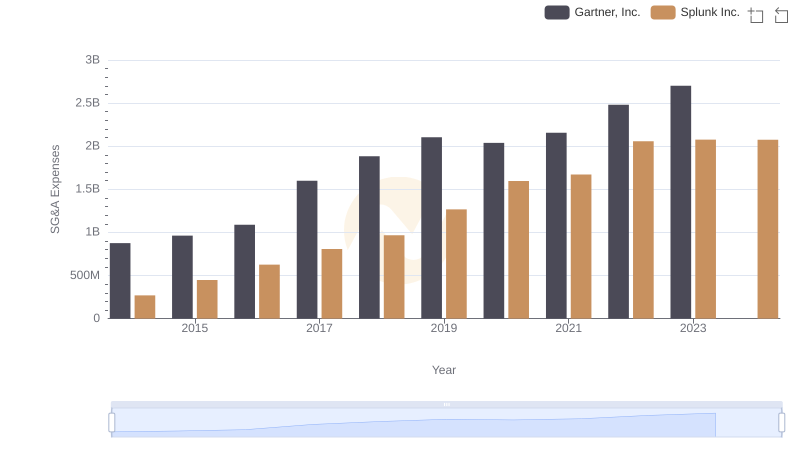
Gartner, Inc. vs Splunk Inc.: SG&A Expense Trends