| __timestamp | Gartner, Inc. | Splunk Inc. |
|---|---|---|
| Wednesday, January 1, 2014 | 797933000 | 75895000 |
| Thursday, January 1, 2015 | 839076000 | 150790000 |
| Friday, January 1, 2016 | 945648000 | 215309000 |
| Sunday, January 1, 2017 | 1320198000 | 295850000 |
| Monday, January 1, 2018 | 1468800000 | 301114000 |
| Tuesday, January 1, 2019 | 1550568000 | 441969000 |
| Wednesday, January 1, 2020 | 1345024000 | 619800000 |
| Friday, January 1, 2021 | 1444093000 | 791026000 |
| Saturday, January 1, 2022 | 1693771000 | 1029574000 |
| Sunday, January 1, 2023 | 47800000 | 997170000 |
| Monday, January 1, 2024 | 2023022000 | 918834000 |
Unleashing insights
In the ever-evolving landscape of technology, research and development (R&D) budgets are a testament to a company's commitment to innovation. Over the past decade, Gartner, Inc. and Splunk Inc. have demonstrated contrasting strategies in their R&D investments.
From 2014 to 2022, Gartner, Inc. consistently increased its R&D spending, peaking in 2022 with a 112% rise from 2014. This steady growth underscores Gartner's dedication to maintaining its leadership in research-driven insights.
Splunk Inc., on the other hand, showcased a more aggressive R&D strategy. By 2022, Splunk's R&D expenses surged by over 1,250% compared to 2014, reflecting its rapid expansion and focus on data analytics innovation.
Interestingly, Gartner's 2023 data is missing, leaving a gap in the narrative. However, Splunk continued its robust investment, albeit slightly lower than the previous year.
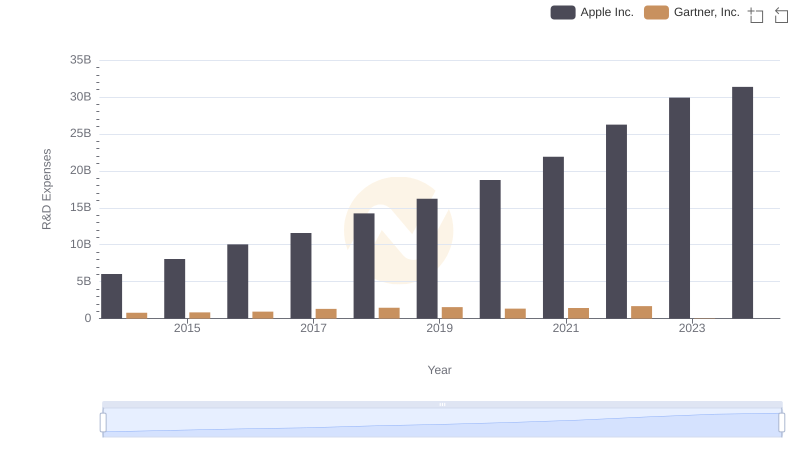
Who Prioritizes Innovation? R&D Spending Compared for Apple Inc. and Gartner, Inc.
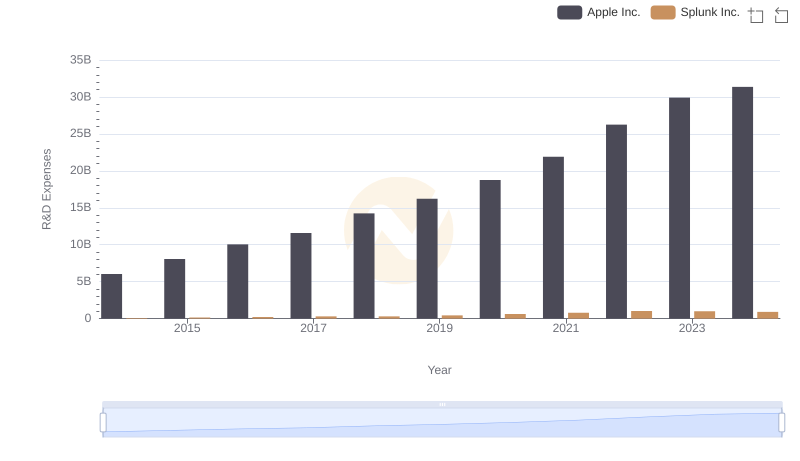
Comparing Innovation Spending: Apple Inc. and Splunk Inc.
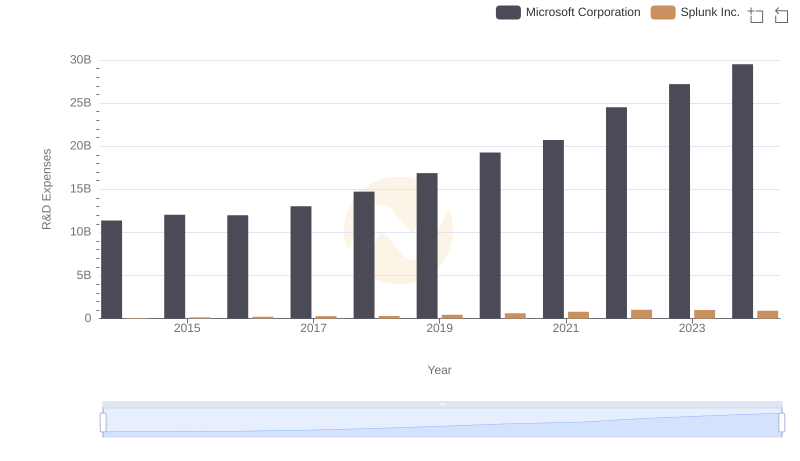
Research and Development Investment: Microsoft Corporation vs Splunk Inc.
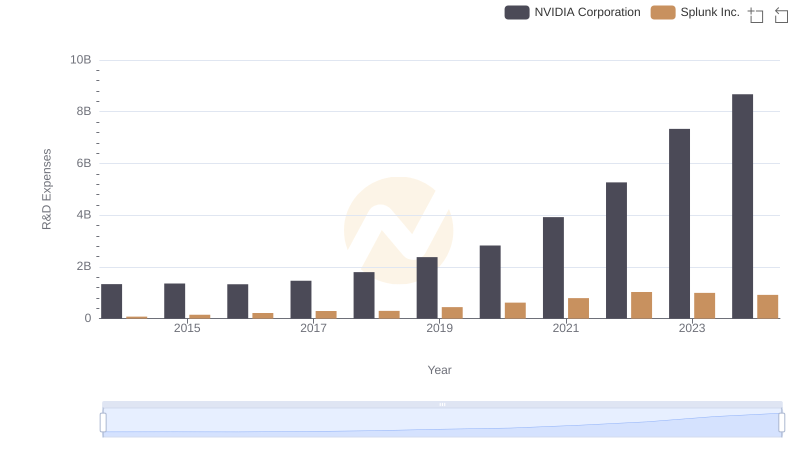
Research and Development Investment: NVIDIA Corporation vs Splunk Inc.
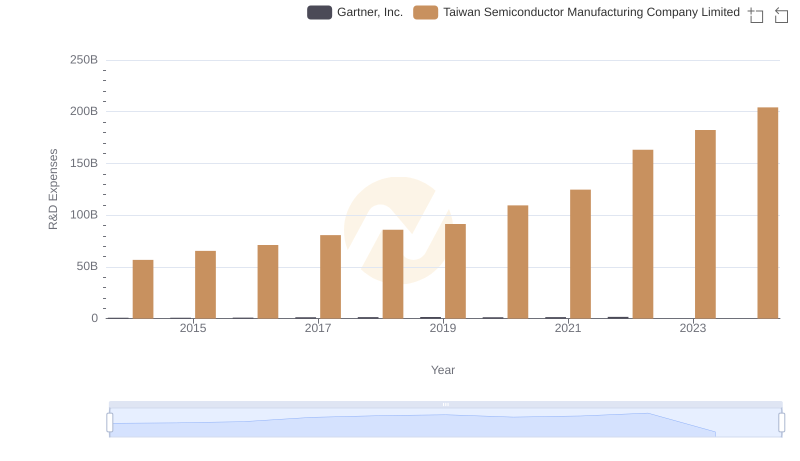
Research and Development: Comparing Key Metrics for Taiwan Semiconductor Manufacturing Company Limited and Gartner, Inc.
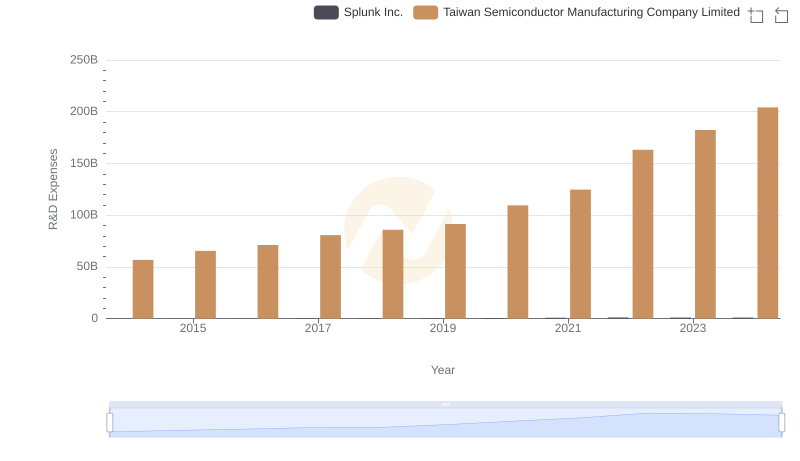
Analyzing R&D Budgets: Taiwan Semiconductor Manufacturing Company Limited vs Splunk Inc.
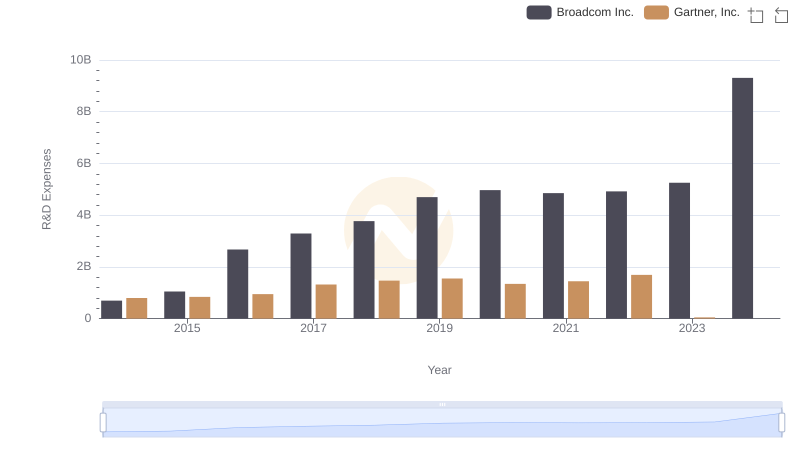
Research and Development Expenses Breakdown: Broadcom Inc. vs Gartner, Inc.
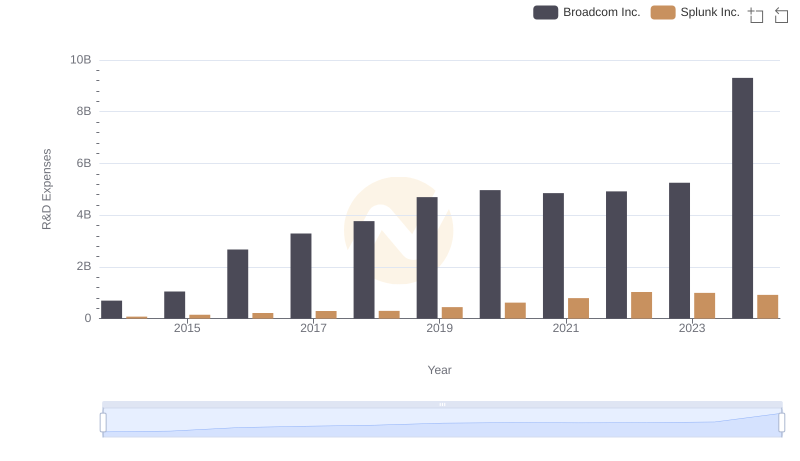
Comparing Innovation Spending: Broadcom Inc. and Splunk Inc.
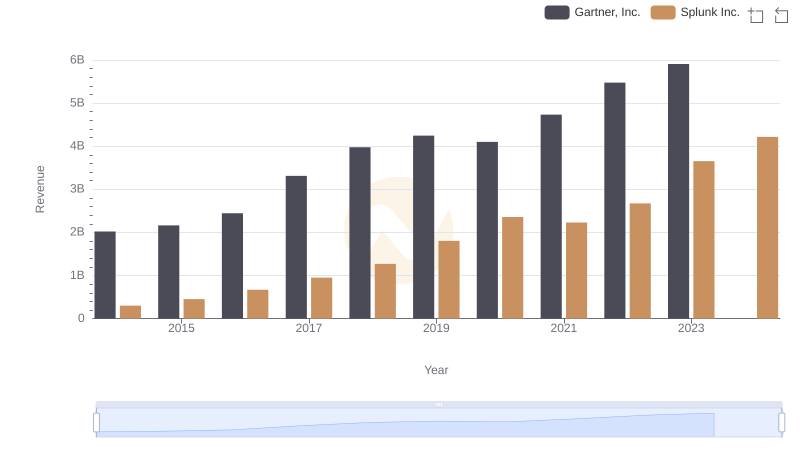
Gartner, Inc. and Splunk Inc.: A Comprehensive Revenue Analysis
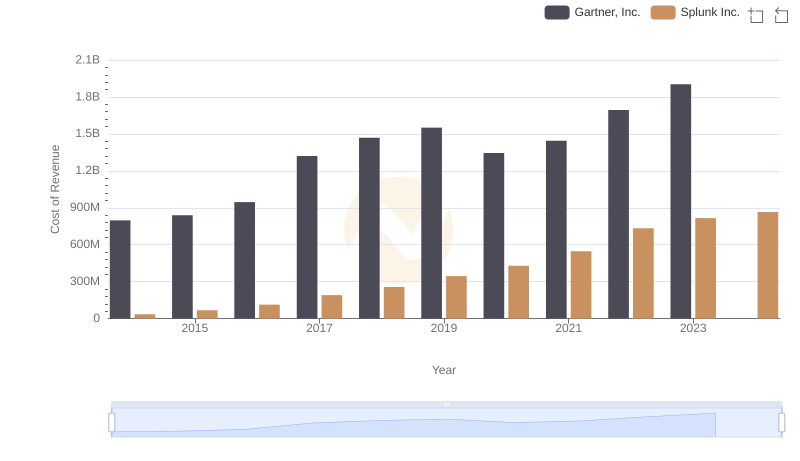
Analyzing Cost of Revenue: Gartner, Inc. and Splunk Inc.
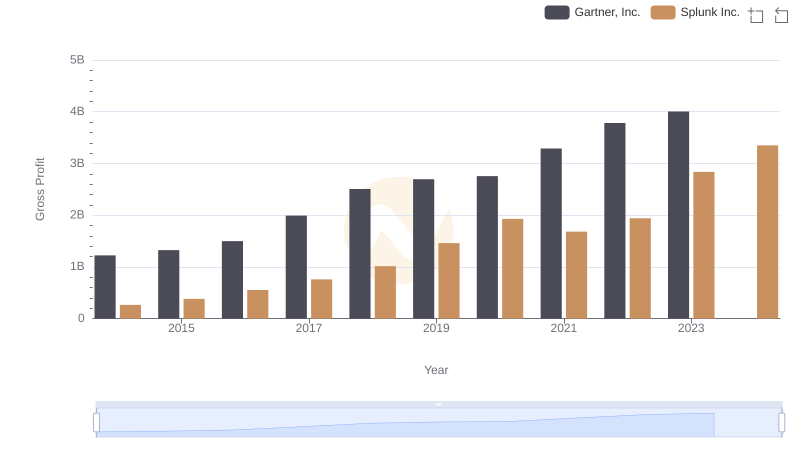
Key Insights on Gross Profit: Gartner, Inc. vs Splunk Inc.
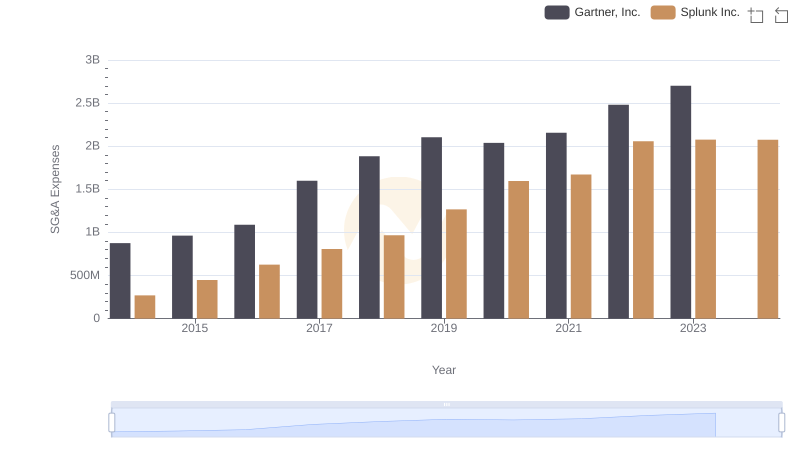
Gartner, Inc. vs Splunk Inc.: SG&A Expense Trends