| __timestamp | Gartner, Inc. | Splunk Inc. |
|---|---|---|
| Wednesday, January 1, 2014 | 797933000 | 35825000 |
| Thursday, January 1, 2015 | 839076000 | 68378000 |
| Friday, January 1, 2016 | 945648000 | 114122000 |
| Sunday, January 1, 2017 | 1320198000 | 191053000 |
| Monday, January 1, 2018 | 1468800000 | 256409000 |
| Tuesday, January 1, 2019 | 1550568000 | 344676000 |
| Wednesday, January 1, 2020 | 1345096000 | 429788000 |
| Friday, January 1, 2021 | 1444106000 | 547345000 |
| Saturday, January 1, 2022 | 1693805000 | 733969000 |
| Sunday, January 1, 2023 | 1903240000 | 815995000 |
| Monday, January 1, 2024 | 0 | 865507000 |
In pursuit of knowledge
In the ever-evolving landscape of technology and data analytics, understanding the cost dynamics of leading companies is crucial. Over the past decade, Gartner, Inc. and Splunk Inc. have showcased intriguing trends in their cost of revenue. From 2014 to 2023, Gartner's cost of revenue surged by approximately 138%, reflecting its expanding influence in the tech advisory sector. Meanwhile, Splunk Inc., a leader in data analytics, witnessed a staggering increase of over 2,200% in the same period, highlighting its rapid growth and market penetration.
Interestingly, while Gartner's cost of revenue consistently grew, Splunk's trajectory was more volatile, with significant jumps post-2016. This disparity underscores the different operational strategies and market challenges faced by these giants. As we look to 2024, with some data yet to be reported, these trends offer a glimpse into the strategic priorities shaping the future of tech enterprises.
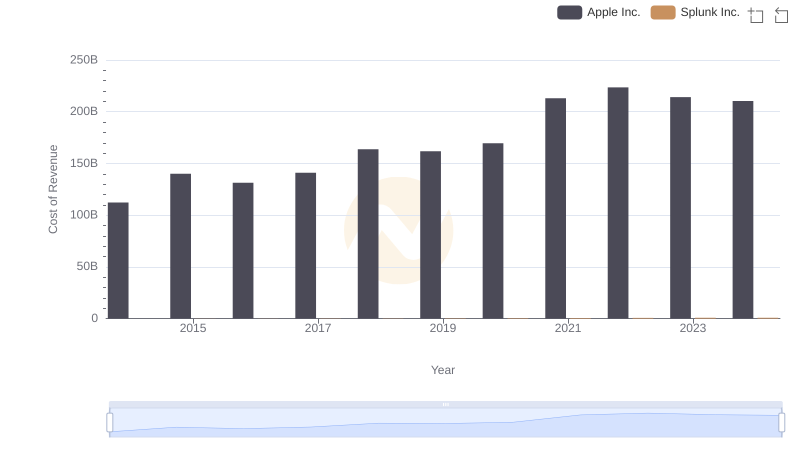
Cost Insights: Breaking Down Apple Inc. and Splunk Inc.'s Expenses
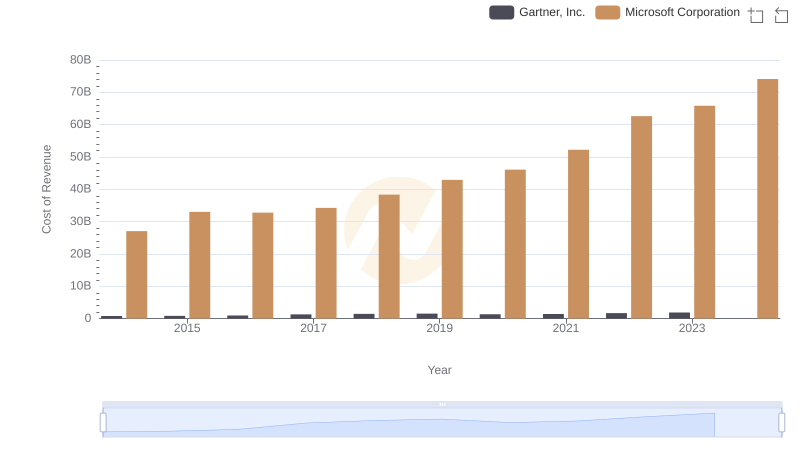
Cost of Revenue: Key Insights for Microsoft Corporation and Gartner, Inc.
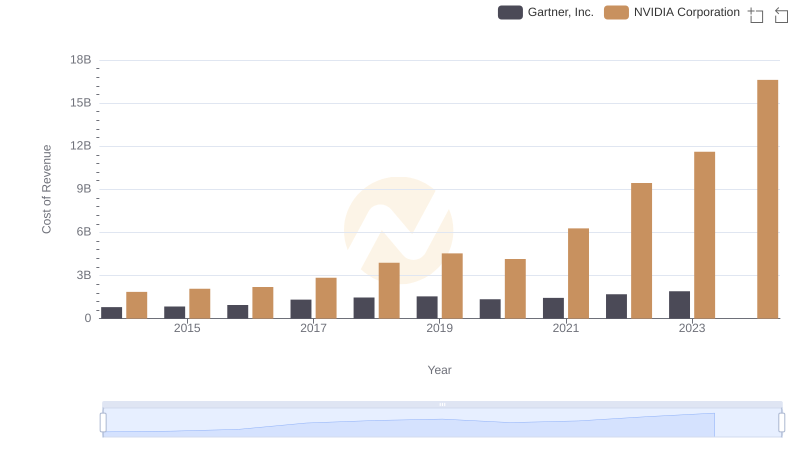
Cost of Revenue: Key Insights for NVIDIA Corporation and Gartner, Inc.
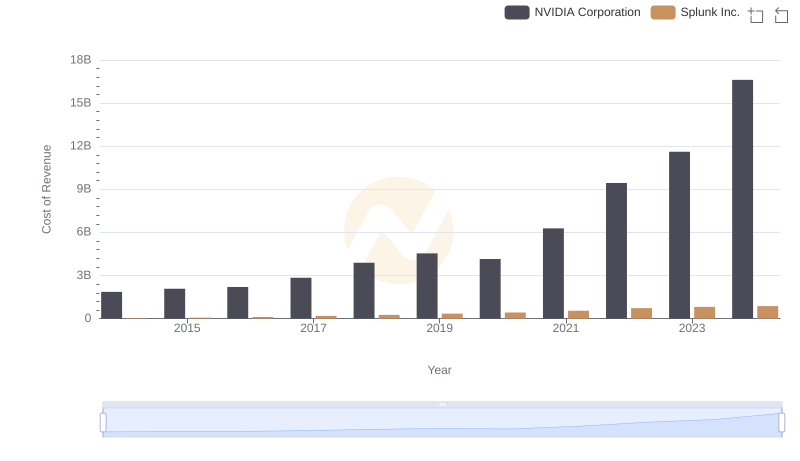
Comparing Cost of Revenue Efficiency: NVIDIA Corporation vs Splunk Inc.
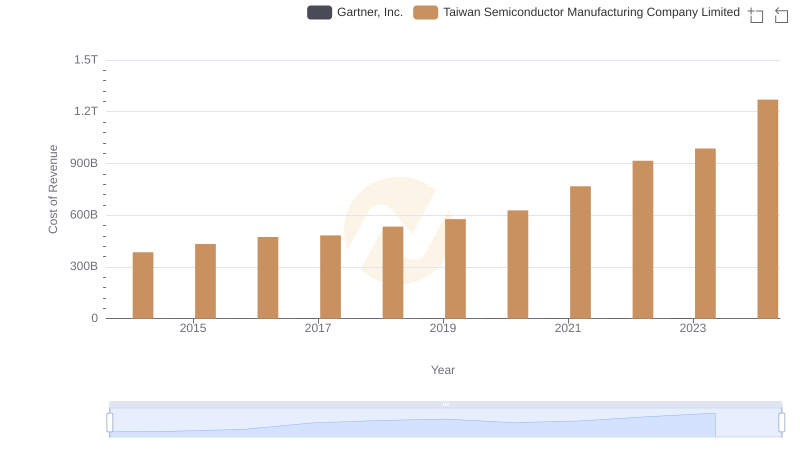
Cost Insights: Breaking Down Taiwan Semiconductor Manufacturing Company Limited and Gartner, Inc.'s Expenses
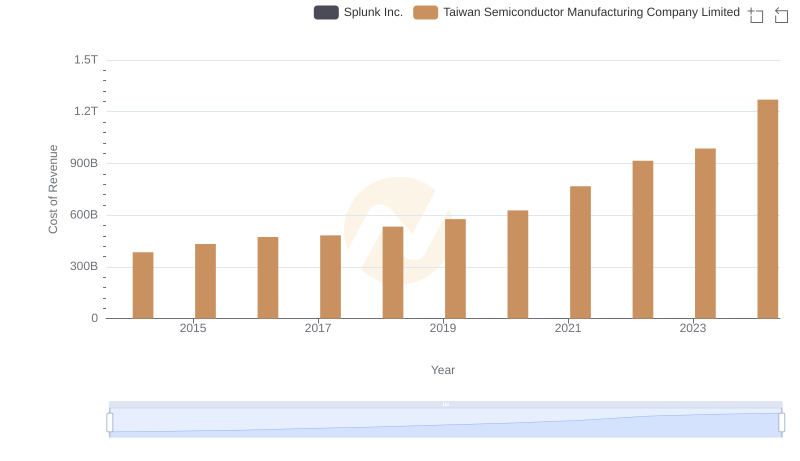
Cost of Revenue: Key Insights for Taiwan Semiconductor Manufacturing Company Limited and Splunk Inc.
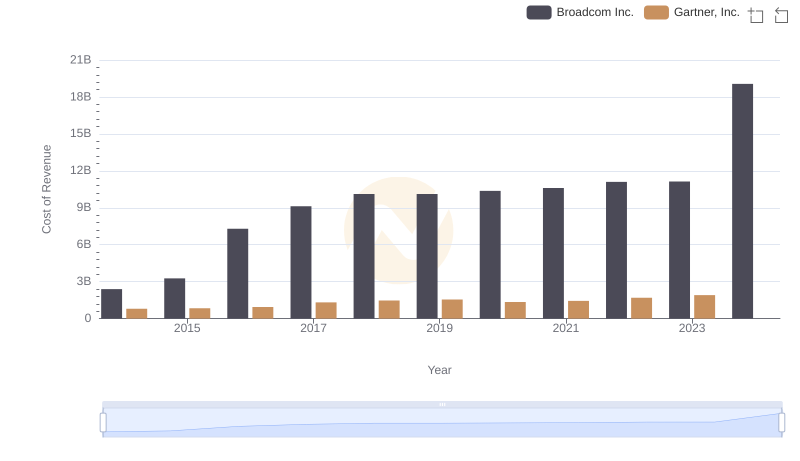
Comparing Cost of Revenue Efficiency: Broadcom Inc. vs Gartner, Inc.
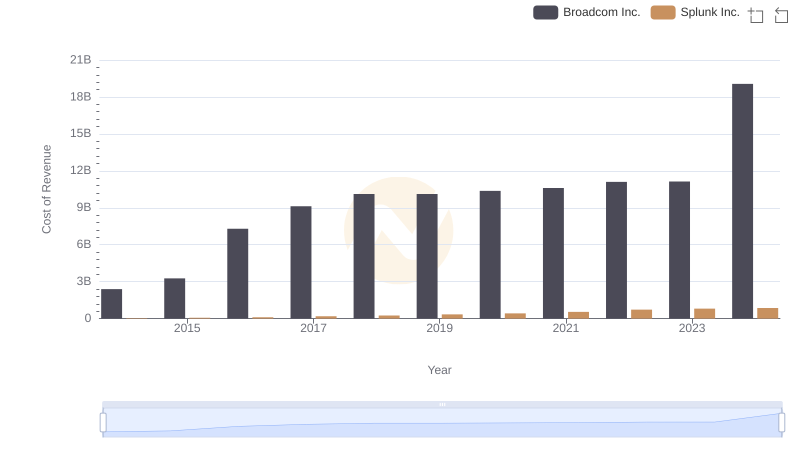
Cost of Revenue Trends: Broadcom Inc. vs Splunk Inc.
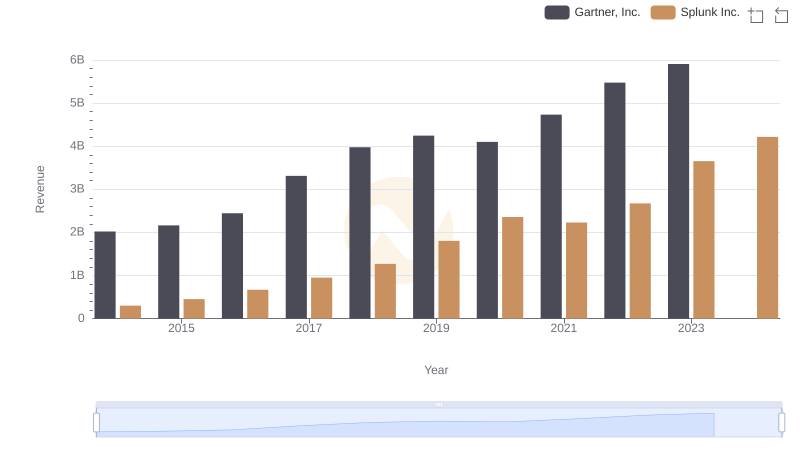
Gartner, Inc. and Splunk Inc.: A Comprehensive Revenue Analysis
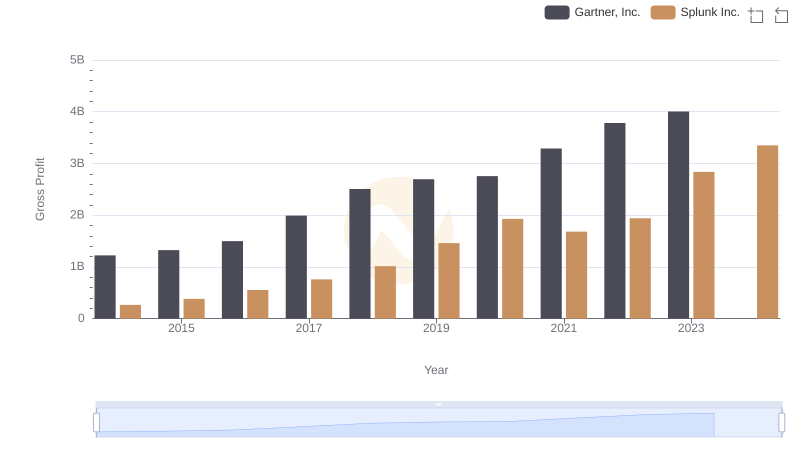
Key Insights on Gross Profit: Gartner, Inc. vs Splunk Inc.
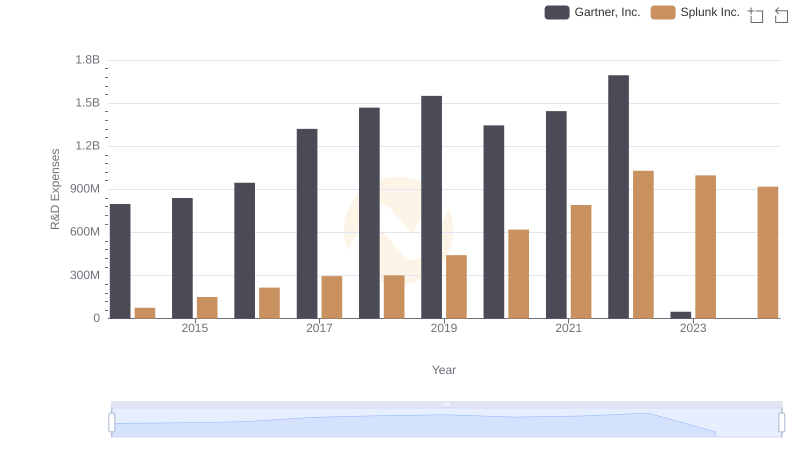
Analyzing R&D Budgets: Gartner, Inc. vs Splunk Inc.
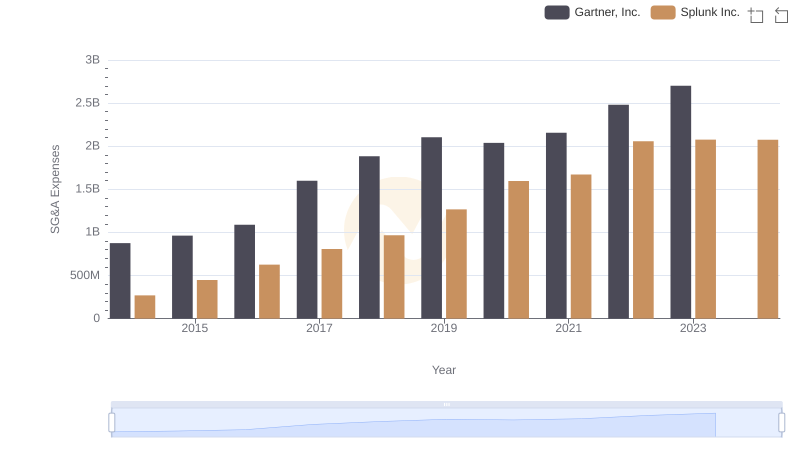
Gartner, Inc. vs Splunk Inc.: SG&A Expense Trends