| __timestamp | Gartner, Inc. | Splunk Inc. |
|---|---|---|
| Wednesday, January 1, 2014 | 876067000 | 269210000 |
| Thursday, January 1, 2015 | 962677000 | 447517000 |
| Friday, January 1, 2016 | 1089184000 | 626927000 |
| Sunday, January 1, 2017 | 1599004000 | 806883000 |
| Monday, January 1, 2018 | 1884141000 | 967560000 |
| Tuesday, January 1, 2019 | 2103424000 | 1267538000 |
| Wednesday, January 1, 2020 | 2039087000 | 1596475000 |
| Friday, January 1, 2021 | 2155724000 | 1671200000 |
| Saturday, January 1, 2022 | 2480846000 | 2056950000 |
| Sunday, January 1, 2023 | 2701542000 | 2076049000 |
| Monday, January 1, 2024 | 2884814000 | 2074630000 |
Unleashing the power of data
In the ever-evolving landscape of technology companies, understanding financial trends is crucial. This analysis delves into the Selling, General, and Administrative (SG&A) expenses of two industry giants: Gartner, Inc. and Splunk Inc., from 2014 to 2023.
Gartner, Inc. has seen a steady increase in SG&A expenses, growing by approximately 208% over the decade. Starting at around $876 million in 2014, it reached nearly $2.7 billion by 2023. This growth reflects Gartner's expanding operations and market influence.
Conversely, Splunk Inc. exhibited a more volatile trend, with expenses rising from $269 million in 2014 to over $2 billion in 2023, marking a 670% increase. This surge underscores Splunk's aggressive growth strategy and market penetration.
The data for 2024 is incomplete, highlighting the dynamic nature of financial forecasting in the tech sector.
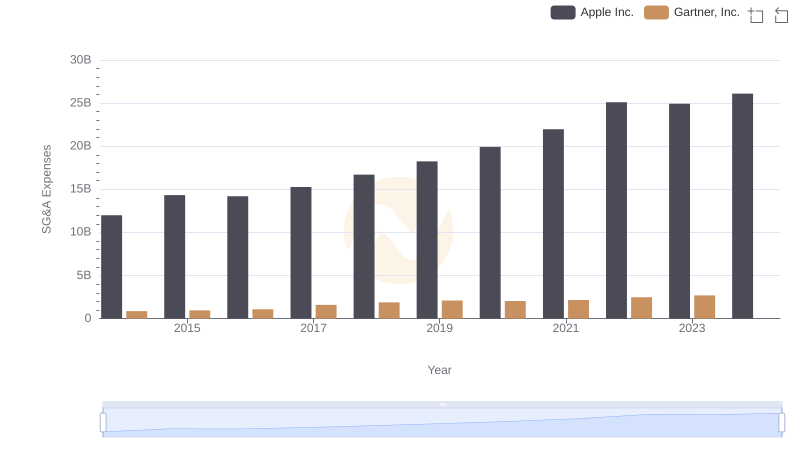
SG&A Efficiency Analysis: Comparing Apple Inc. and Gartner, Inc.
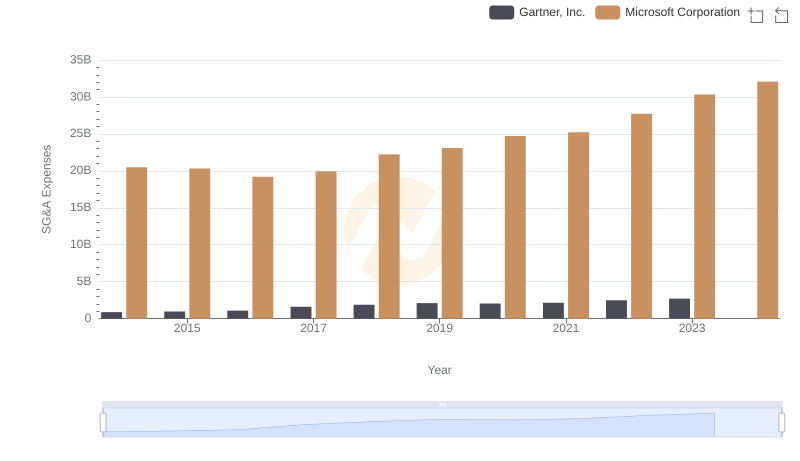
Who Optimizes SG&A Costs Better? Microsoft Corporation or Gartner, Inc.
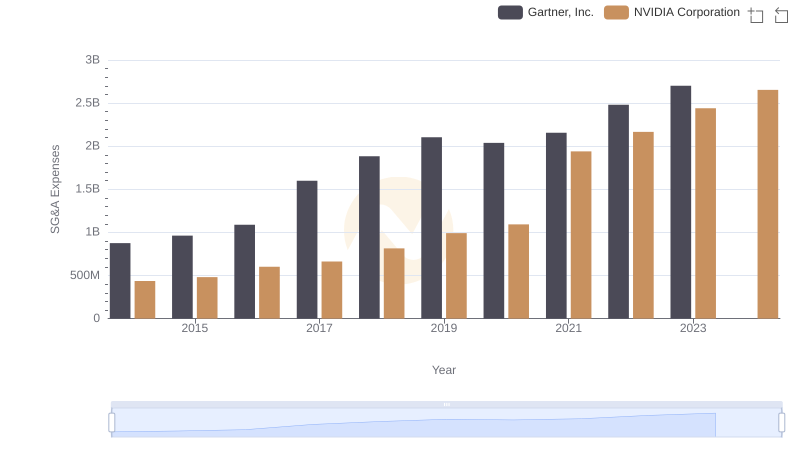
Cost Management Insights: SG&A Expenses for NVIDIA Corporation and Gartner, Inc.
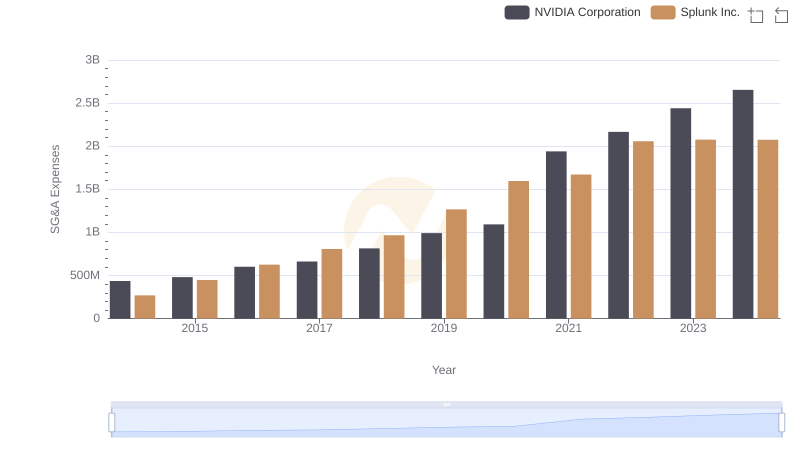
Comparing SG&A Expenses: NVIDIA Corporation vs Splunk Inc. Trends and Insights
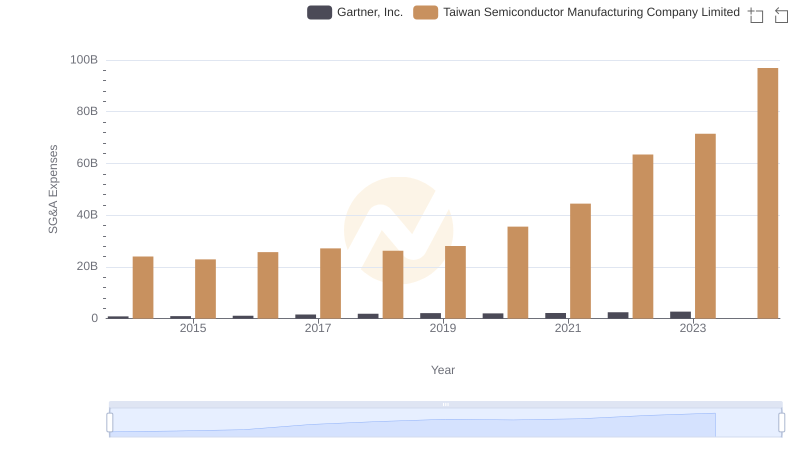
Breaking Down SG&A Expenses: Taiwan Semiconductor Manufacturing Company Limited vs Gartner, Inc.
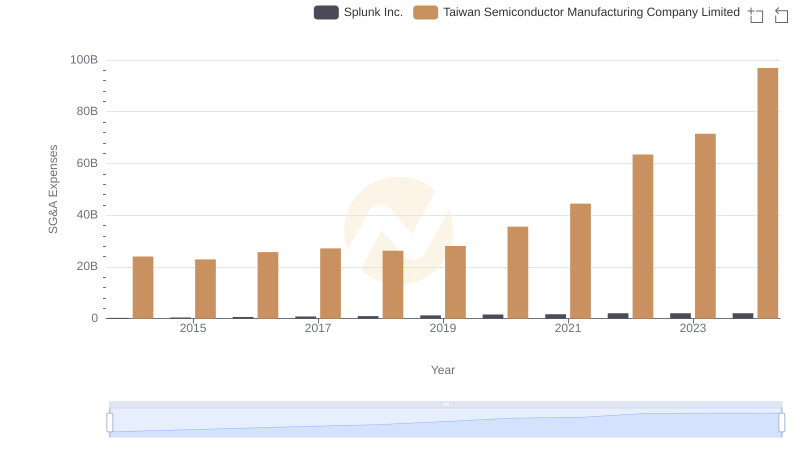
Operational Costs Compared: SG&A Analysis of Taiwan Semiconductor Manufacturing Company Limited and Splunk Inc.
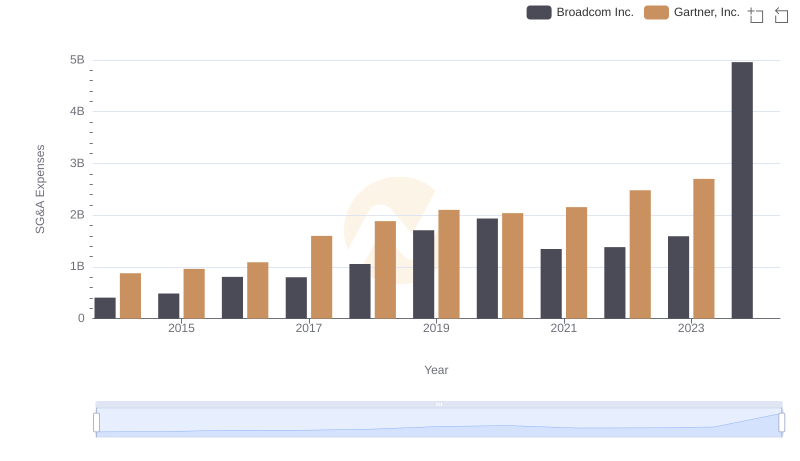
Broadcom Inc. or Gartner, Inc.: Who Manages SG&A Costs Better?
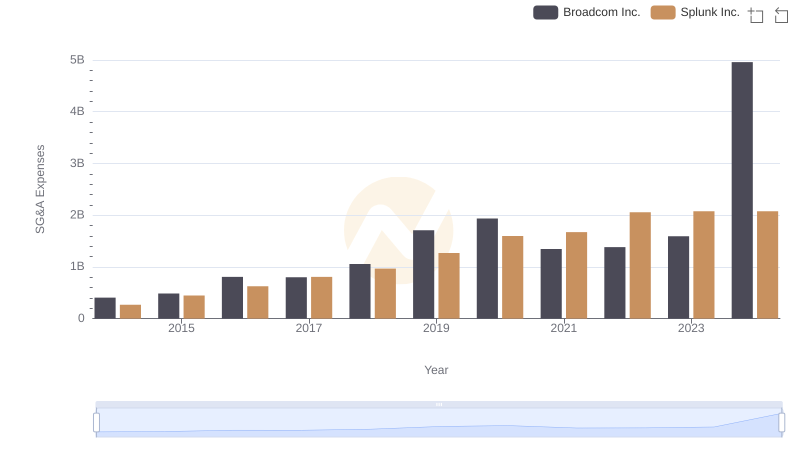
Breaking Down SG&A Expenses: Broadcom Inc. vs Splunk Inc.
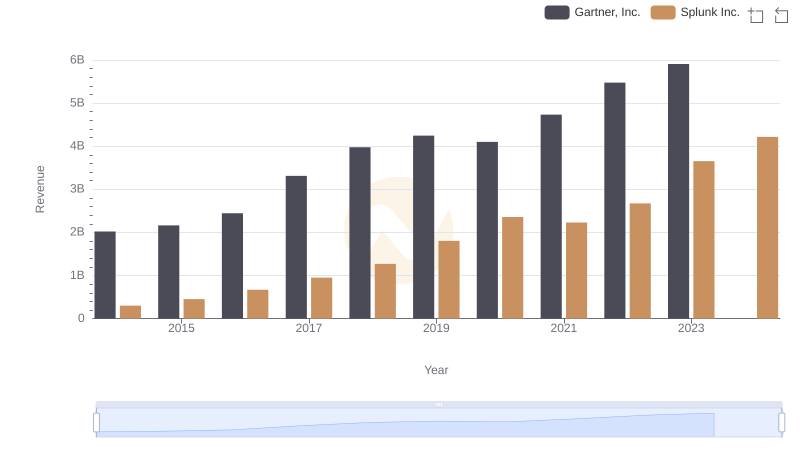
Gartner, Inc. and Splunk Inc.: A Comprehensive Revenue Analysis
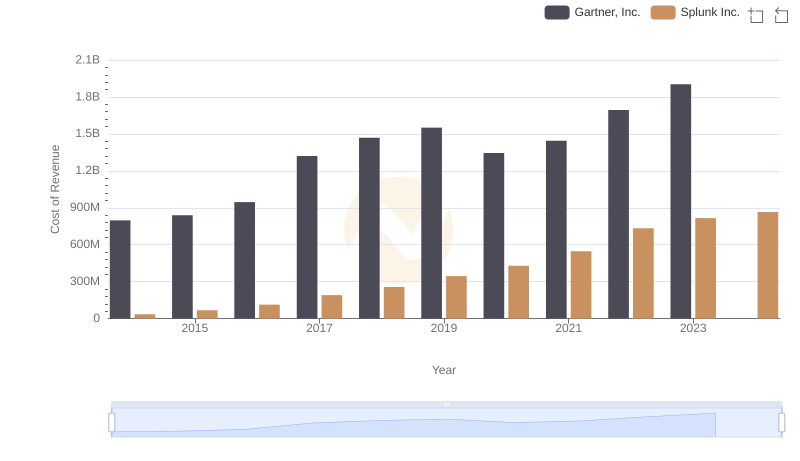
Analyzing Cost of Revenue: Gartner, Inc. and Splunk Inc.
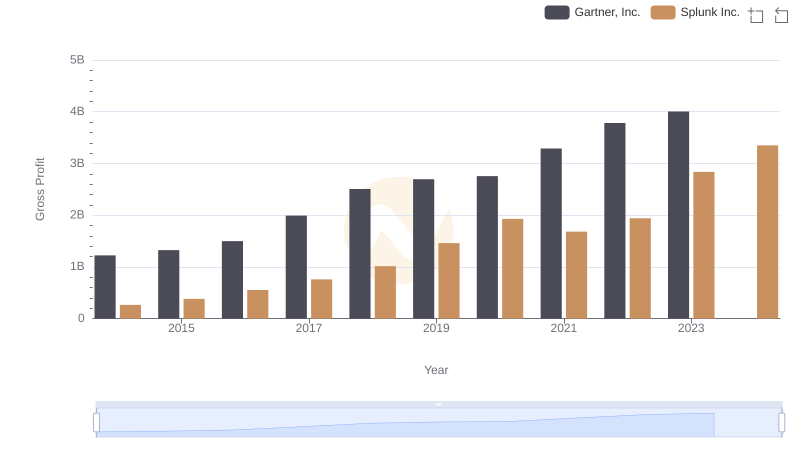
Key Insights on Gross Profit: Gartner, Inc. vs Splunk Inc.
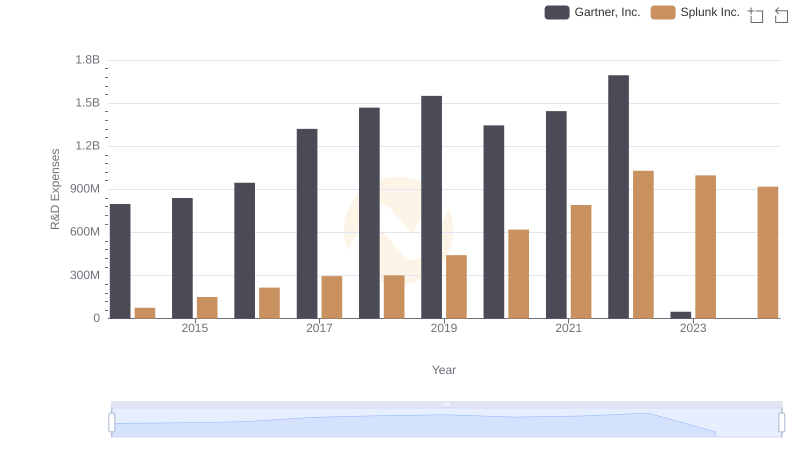
Analyzing R&D Budgets: Gartner, Inc. vs Splunk Inc.