| __timestamp | Autodesk, Inc. | International Business Machines Corporation |
|---|---|---|
| Wednesday, January 1, 2014 | 1090900000 | 22472000000 |
| Thursday, January 1, 2015 | 1281300000 | 19894000000 |
| Friday, January 1, 2016 | 1308900000 | 20279000000 |
| Sunday, January 1, 2017 | 1310300000 | 19680000000 |
| Monday, January 1, 2018 | 1392500000 | 19366000000 |
| Tuesday, January 1, 2019 | 1524000000 | 18724000000 |
| Wednesday, January 1, 2020 | 1715900000 | 20561000000 |
| Friday, January 1, 2021 | 1854200000 | 18745000000 |
| Saturday, January 1, 2022 | 2194800000 | 17483000000 |
| Sunday, January 1, 2023 | 2277000000 | 17997000000 |
| Monday, January 1, 2024 | 2443000000 | 29536000000 |
Unleashing the power of data
In the ever-evolving landscape of technology, understanding the financial strategies of industry giants like International Business Machines Corporation (IBM) and Autodesk, Inc. is crucial. Over the past decade, from 2014 to 2024, these companies have shown distinct trends in their Selling, General, and Administrative (SG&A) expenses, reflecting their strategic priorities.
IBM, a stalwart in the tech industry, has seen its SG&A expenses fluctuate, peaking in 2024 with a 48% increase from 2023. This surge could indicate a strategic pivot or investment in new ventures. In contrast, Autodesk, a leader in design software, has steadily increased its SG&A expenses by approximately 124% over the same period, suggesting a consistent investment in growth and market expansion.
These trends highlight the differing approaches of these tech titans: IBM's adaptive strategy versus Autodesk's steady growth trajectory. As the tech industry continues to evolve, monitoring these financial strategies offers valuable insights into their future directions.
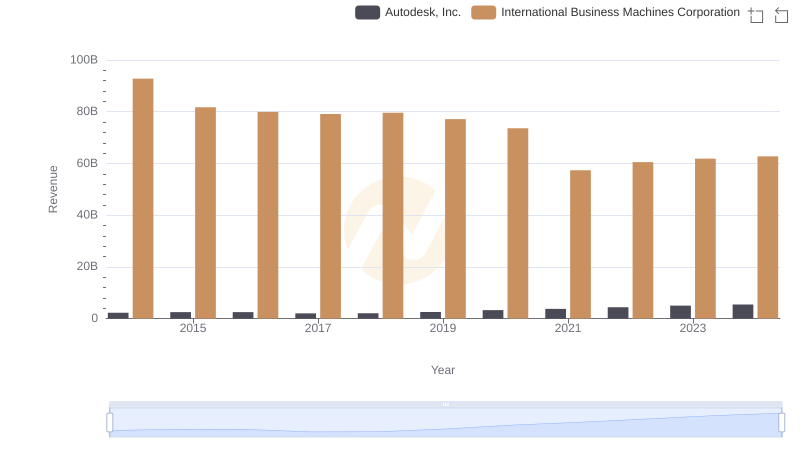
Breaking Down Revenue Trends: International Business Machines Corporation vs Autodesk, Inc.
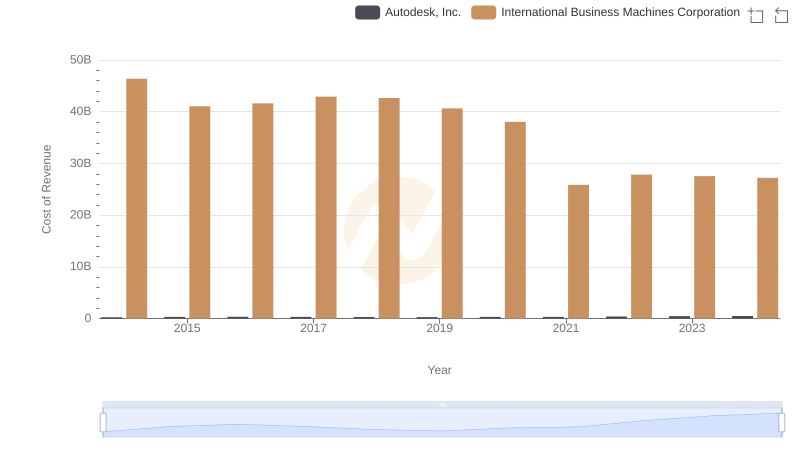
Cost of Revenue Trends: International Business Machines Corporation vs Autodesk, Inc.
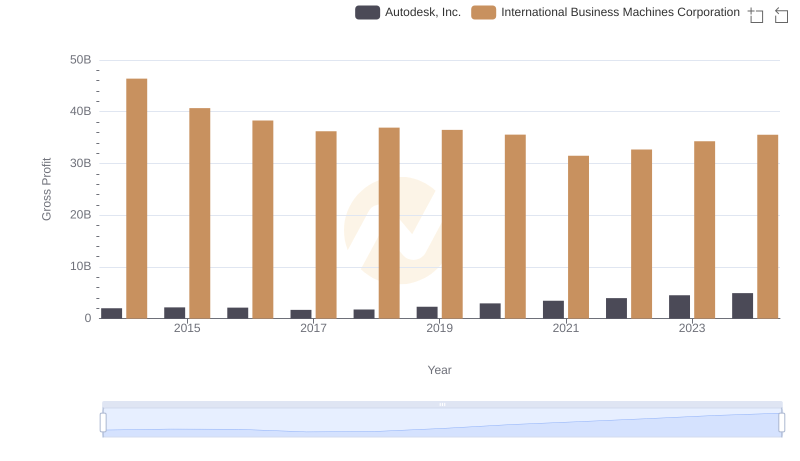
Key Insights on Gross Profit: International Business Machines Corporation vs Autodesk, Inc.
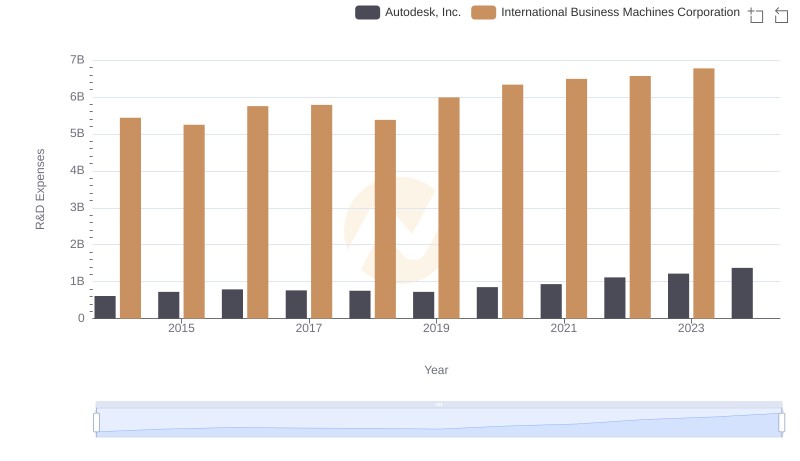
International Business Machines Corporation or Autodesk, Inc.: Who Invests More in Innovation?
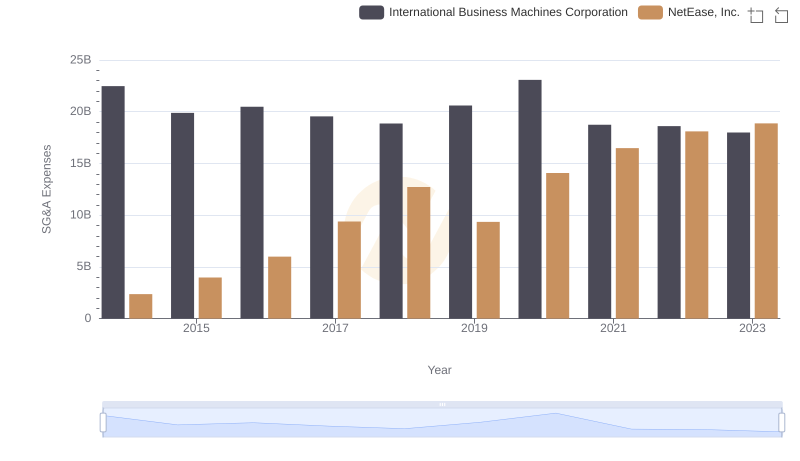
Cost Management Insights: SG&A Expenses for International Business Machines Corporation and NetEase, Inc.
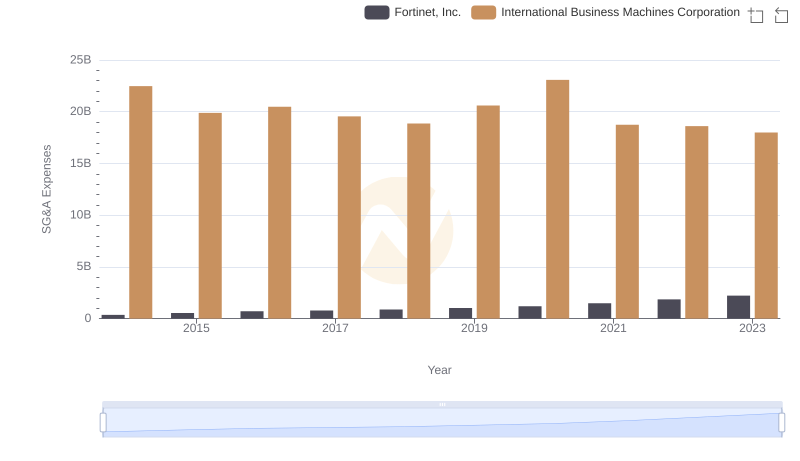
Cost Management Insights: SG&A Expenses for International Business Machines Corporation and Fortinet, Inc.
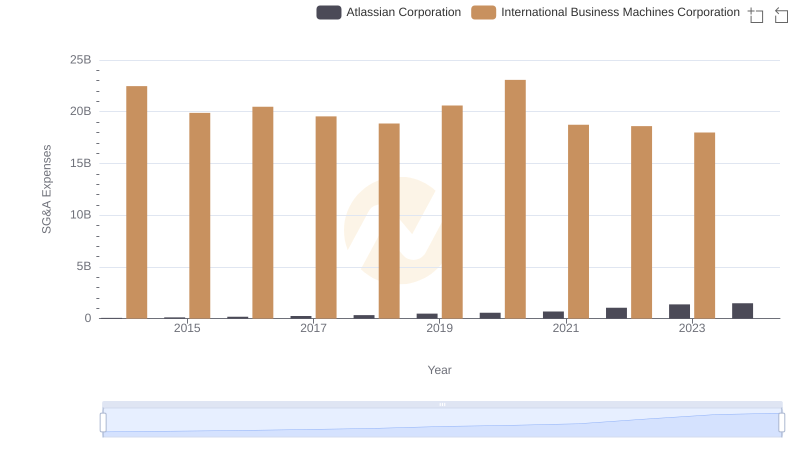
Operational Costs Compared: SG&A Analysis of International Business Machines Corporation and Atlassian Corporation
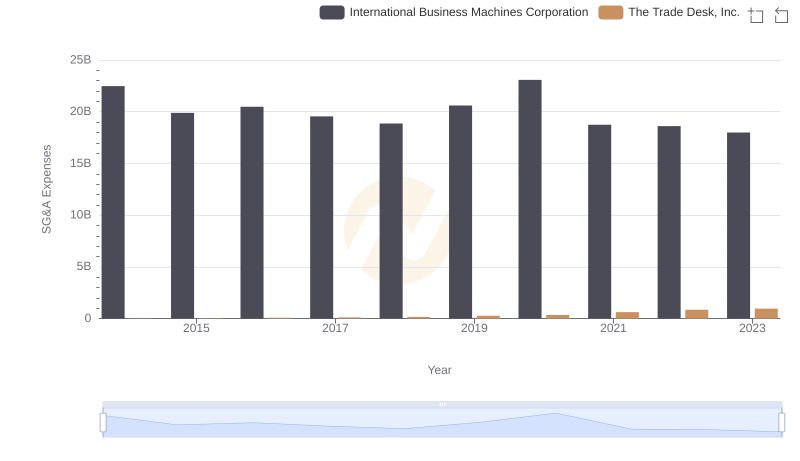
Operational Costs Compared: SG&A Analysis of International Business Machines Corporation and The Trade Desk, Inc.
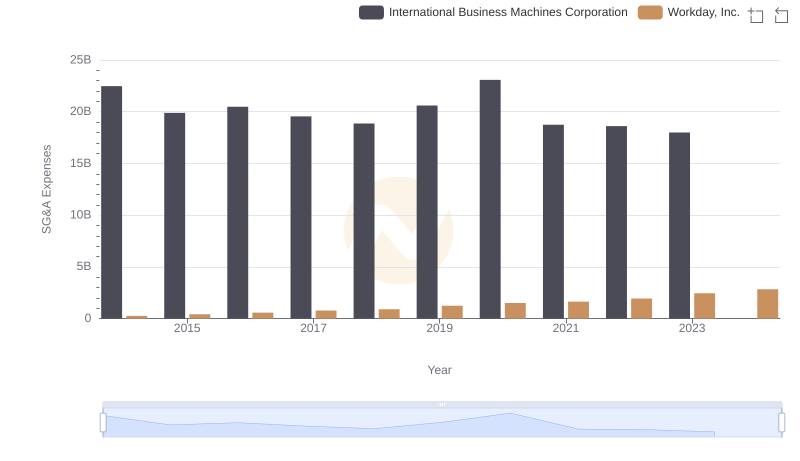
Who Optimizes SG&A Costs Better? International Business Machines Corporation or Workday, Inc.
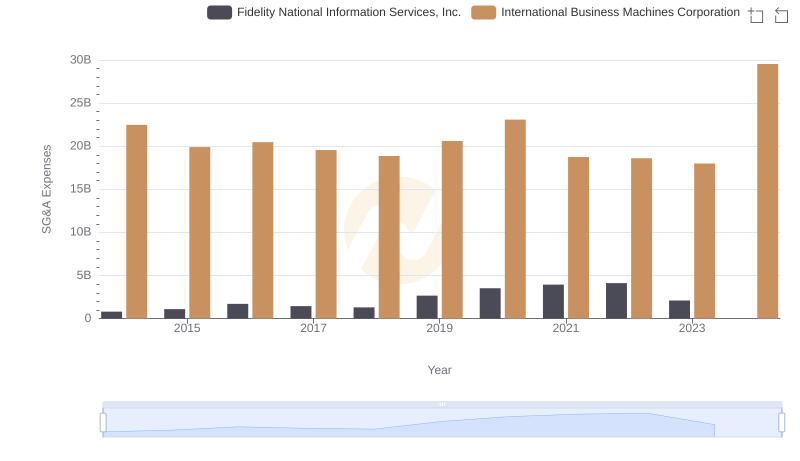
Comparing SG&A Expenses: International Business Machines Corporation vs Fidelity National Information Services, Inc. Trends and Insights
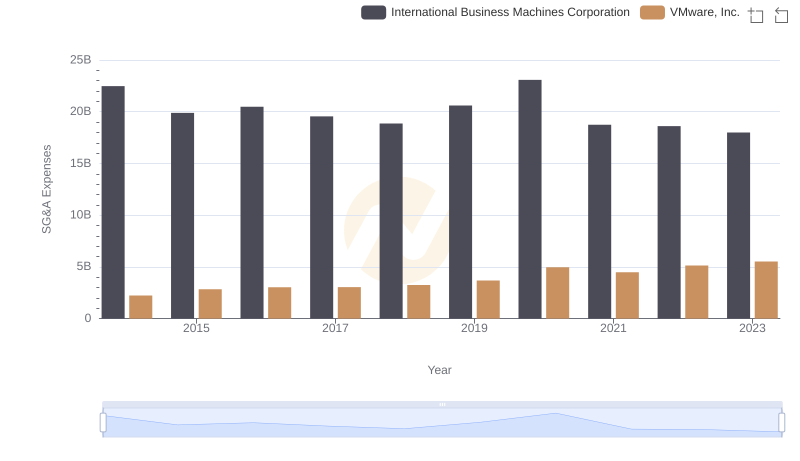
Breaking Down SG&A Expenses: International Business Machines Corporation vs VMware, Inc.
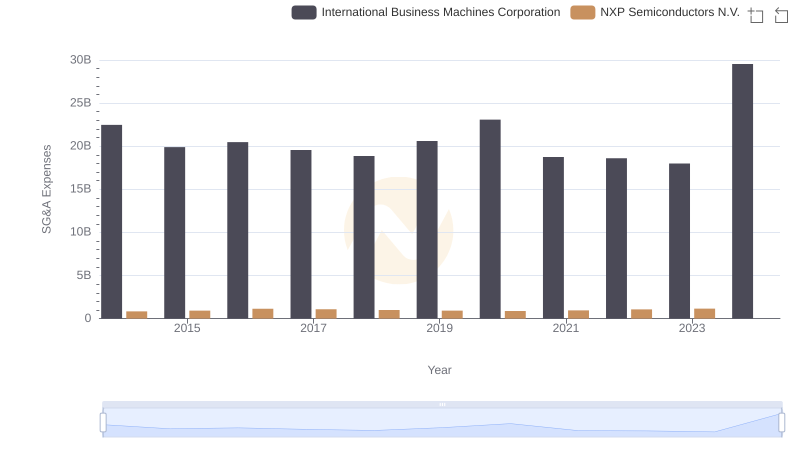
Selling, General, and Administrative Costs: International Business Machines Corporation vs NXP Semiconductors N.V.