| __timestamp | Infosys Limited | ON Semiconductor Corporation |
|---|---|---|
| Wednesday, January 1, 2014 | 1079000000 | 380900000 |
| Thursday, January 1, 2015 | 1176000000 | 386600000 |
| Friday, January 1, 2016 | 1020000000 | 468300000 |
| Sunday, January 1, 2017 | 1279000000 | 600800000 |
| Monday, January 1, 2018 | 1220000000 | 618000000 |
| Tuesday, January 1, 2019 | 1504000000 | 585000000 |
| Wednesday, January 1, 2020 | 1223000000 | 537400000 |
| Friday, January 1, 2021 | 1391000000 | 598400000 |
| Saturday, January 1, 2022 | 1678000000 | 631100000 |
| Sunday, January 1, 2023 | 1632000000 | 641500000 |
| Monday, January 1, 2024 | 649800000 |
Unleashing the power of data
In the ever-evolving landscape of global business, understanding the financial strategies of industry leaders is crucial. Over the past decade, Infosys Limited and ON Semiconductor Corporation have demonstrated distinct approaches to their Selling, General, and Administrative (SG&A) expenses.
From 2014 to 2023, Infosys Limited has seen a consistent increase in SG&A expenses, peaking in 2022 with a 55% rise from 2014. This growth reflects Infosys's strategic investments in expanding its global footprint and enhancing its service offerings.
Conversely, ON Semiconductor Corporation has maintained a more balanced SG&A spending pattern, with a 68% increase over the same period. This indicates a focus on operational efficiency while supporting innovation in semiconductor technology.
These trends highlight the diverse strategies employed by these companies to navigate the competitive tech industry.
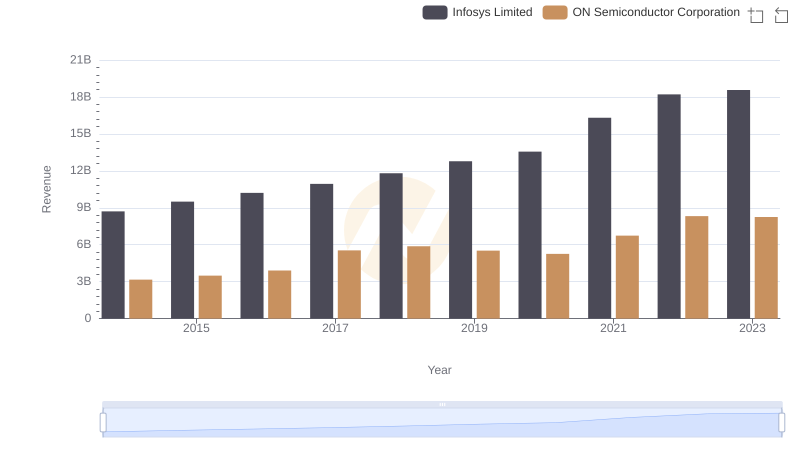
Revenue Showdown: Infosys Limited vs ON Semiconductor Corporation
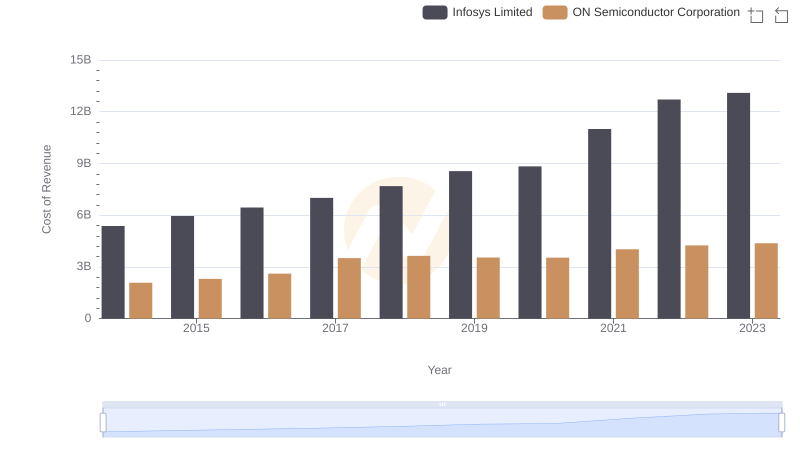
Cost of Revenue: Key Insights for Infosys Limited and ON Semiconductor Corporation
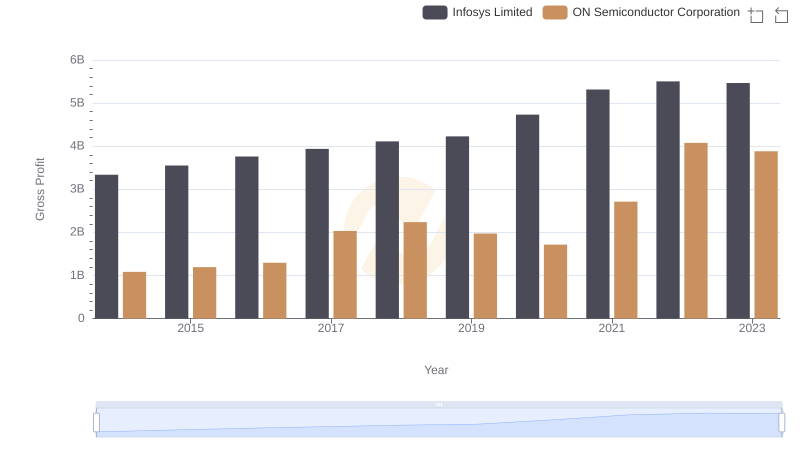
Gross Profit Trends Compared: Infosys Limited vs ON Semiconductor Corporation
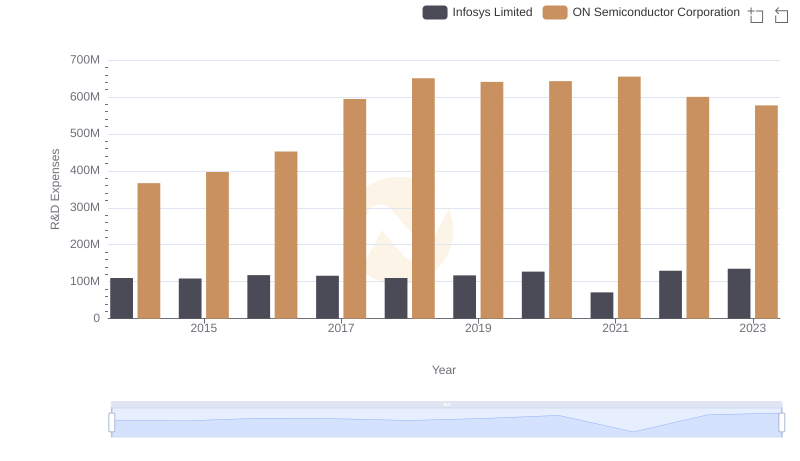
Research and Development Investment: Infosys Limited vs ON Semiconductor Corporation
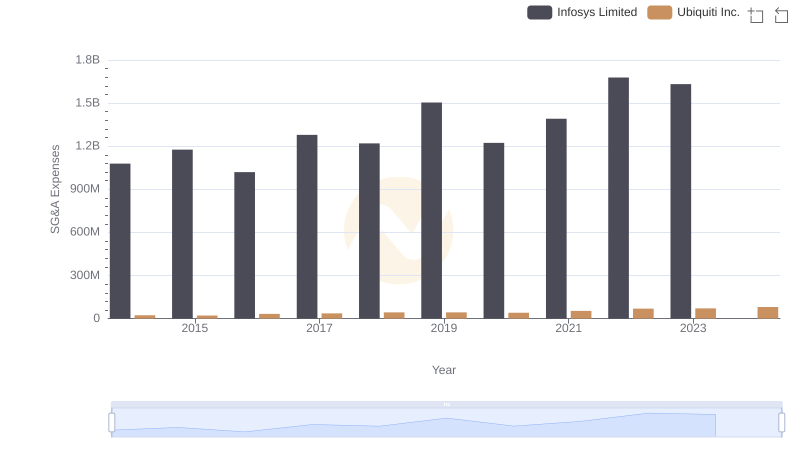
Operational Costs Compared: SG&A Analysis of Infosys Limited and Ubiquiti Inc.
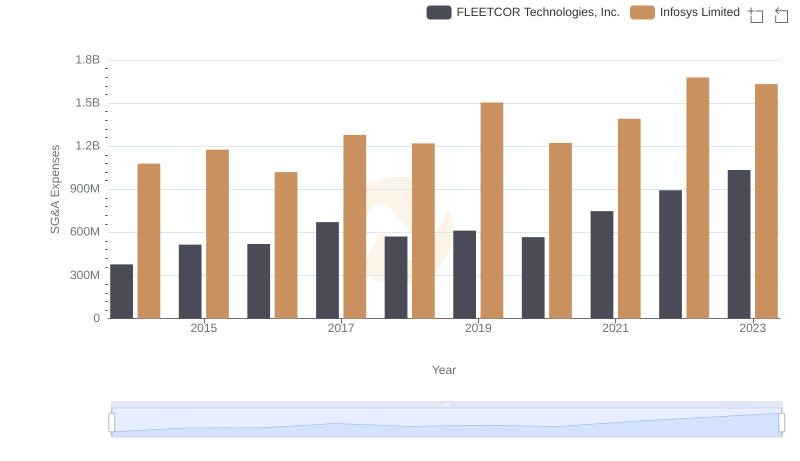
Who Optimizes SG&A Costs Better? Infosys Limited or FLEETCOR Technologies, Inc.
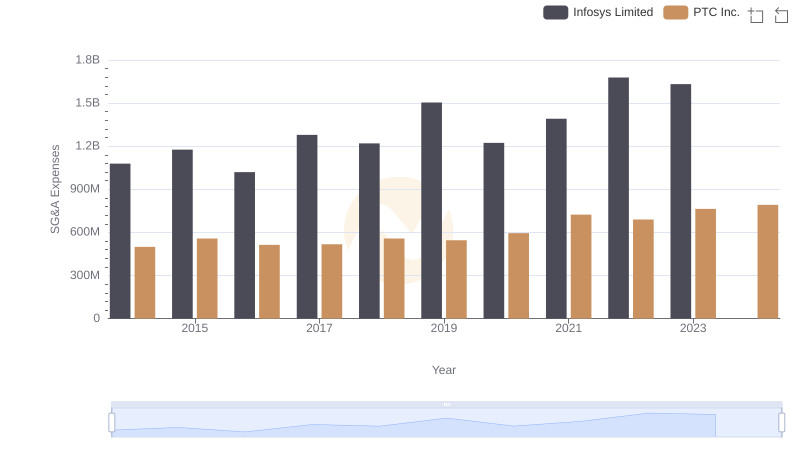
Infosys Limited or PTC Inc.: Who Manages SG&A Costs Better?
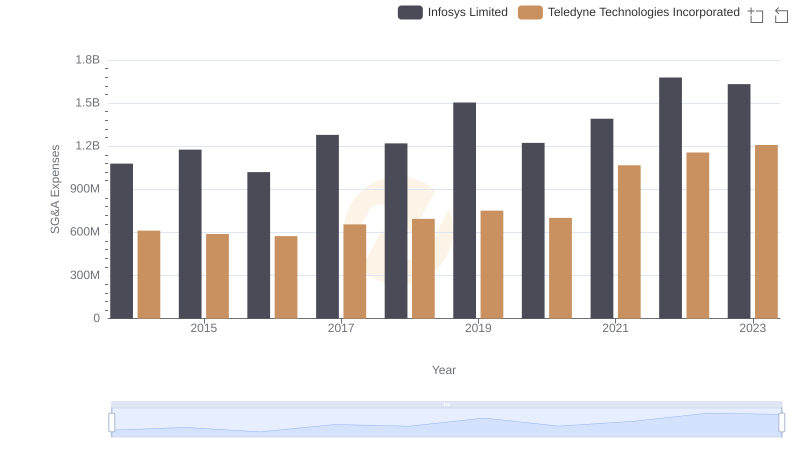
Operational Costs Compared: SG&A Analysis of Infosys Limited and Teledyne Technologies Incorporated
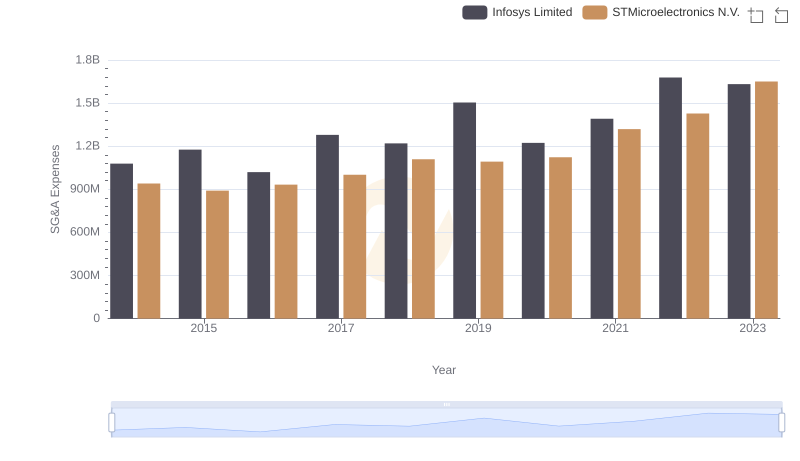
Infosys Limited or STMicroelectronics N.V.: Who Manages SG&A Costs Better?
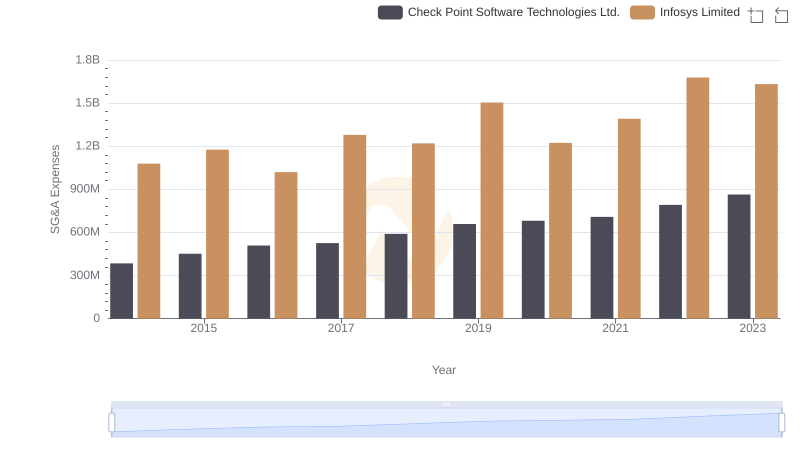
Who Optimizes SG&A Costs Better? Infosys Limited or Check Point Software Technologies Ltd.

A Professional Review of EBITDA: Infosys Limited Compared to ON Semiconductor Corporation
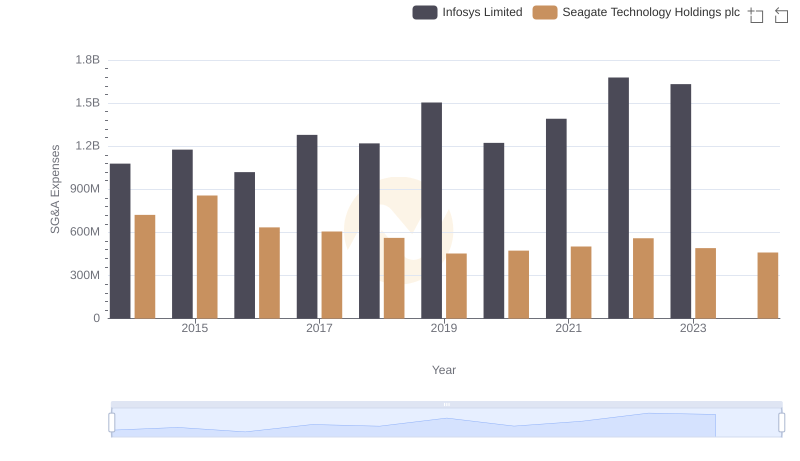
Infosys Limited or Seagate Technology Holdings plc: Who Manages SG&A Costs Better?