| __timestamp | II-VI Incorporated | Super Micro Computer, Inc. |
|---|---|---|
| Wednesday, January 1, 2014 | 137707000 | 61029000 |
| Thursday, January 1, 2015 | 143539000 | 73228000 |
| Friday, January 1, 2016 | 160646000 | 100681000 |
| Sunday, January 1, 2017 | 176002000 | 115331000 |
| Monday, January 1, 2018 | 208565000 | 170176000 |
| Tuesday, January 1, 2019 | 233518000 | 218382000 |
| Wednesday, January 1, 2020 | 440998000 | 219078000 |
| Friday, January 1, 2021 | 483989000 | 186222000 |
| Saturday, January 1, 2022 | 474096000 | 192561000 |
| Sunday, January 1, 2023 | 1036699000 | 214610000 |
| Monday, January 1, 2024 | 854001000 | 383111000 |
Infusing magic into the data realm
In the ever-evolving landscape of corporate finance, understanding the spending patterns of industry leaders is crucial. This analysis delves into the Selling, General, and Administrative (SG&A) expenses of II-VI Incorporated and Super Micro Computer, Inc. over the past decade.
From 2014 to 2023, II-VI Incorporated's SG&A expenses surged by over 650%, peaking in 2023. This dramatic increase reflects strategic investments in growth and expansion. In contrast, Super Micro Computer, Inc. exhibited a more stable trajectory, with a 250% rise in SG&A expenses over the same period. Notably, 2024 data for II-VI is missing, indicating potential reporting delays or strategic shifts.
These trends highlight the contrasting approaches of these tech giants: II-VI's aggressive expansion versus Super Micro's steady growth. Investors and analysts should consider these patterns when evaluating future prospects.
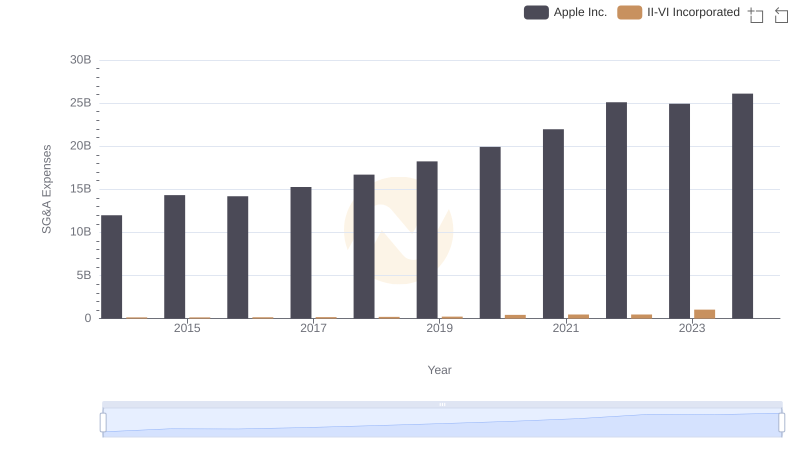
Apple Inc. or II-VI Incorporated: Who Manages SG&A Costs Better?
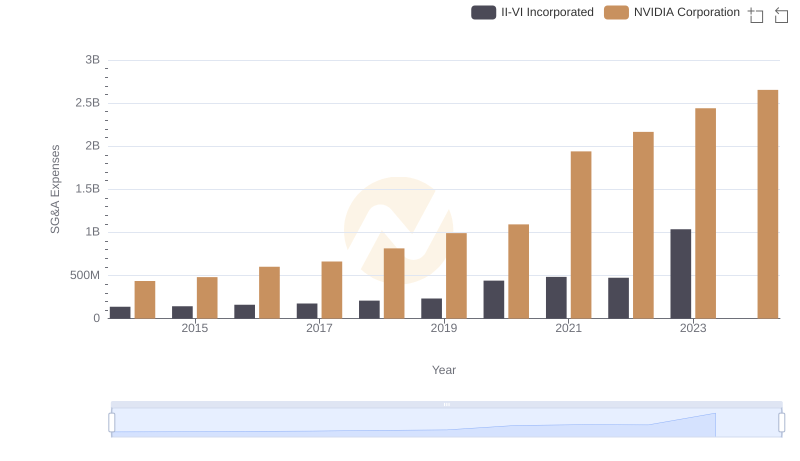
Breaking Down SG&A Expenses: NVIDIA Corporation vs II-VI Incorporated
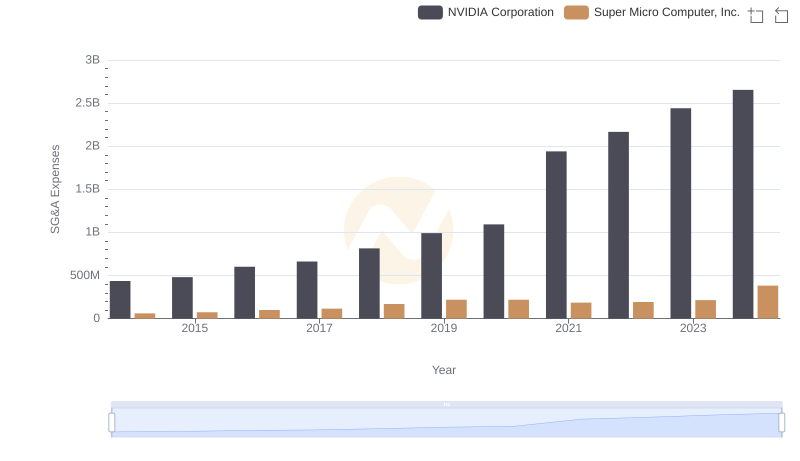
Breaking Down SG&A Expenses: NVIDIA Corporation vs Super Micro Computer, Inc.
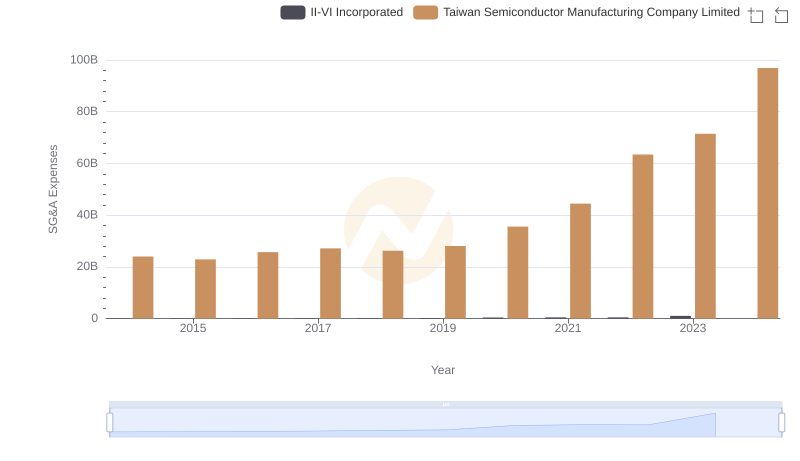
Taiwan Semiconductor Manufacturing Company Limited and II-VI Incorporated: SG&A Spending Patterns Compared
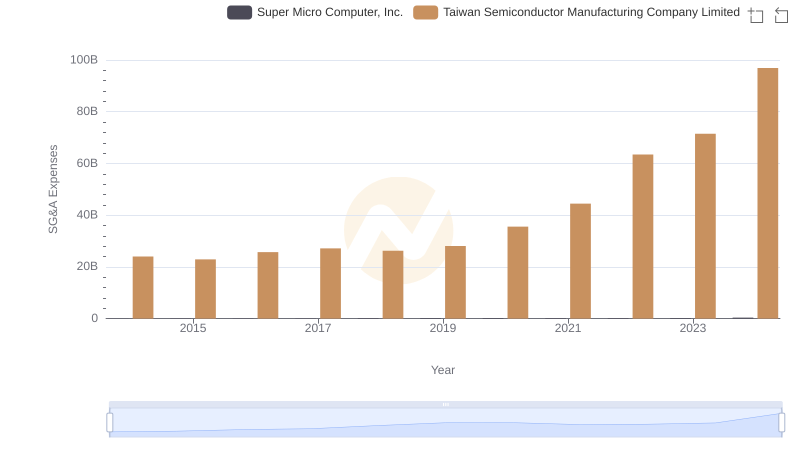
Selling, General, and Administrative Costs: Taiwan Semiconductor Manufacturing Company Limited vs Super Micro Computer, Inc.
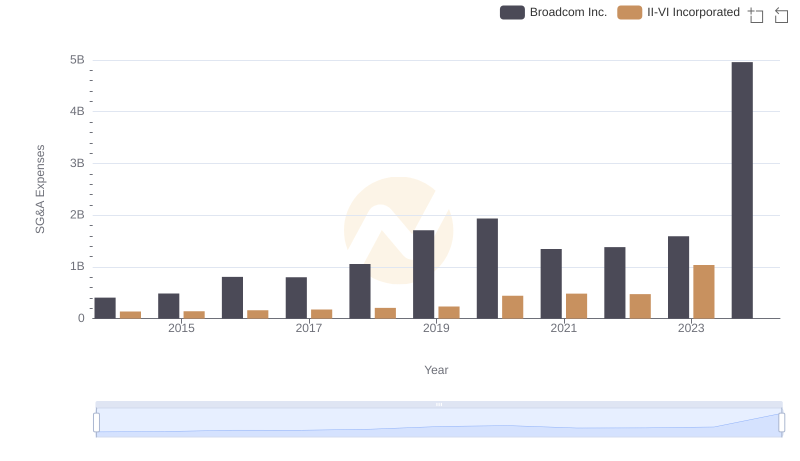
Operational Costs Compared: SG&A Analysis of Broadcom Inc. and II-VI Incorporated
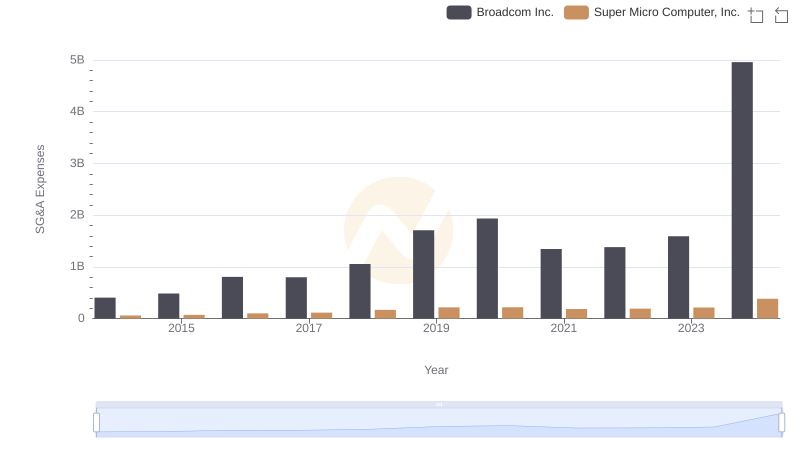
SG&A Efficiency Analysis: Comparing Broadcom Inc. and Super Micro Computer, Inc.
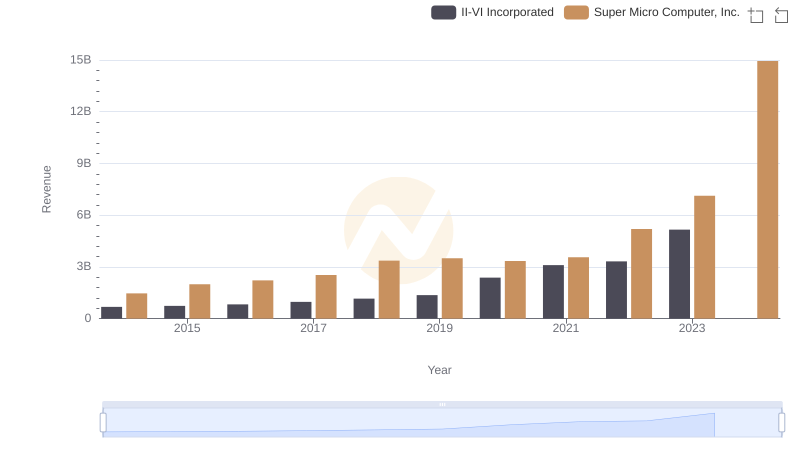
Annual Revenue Comparison: II-VI Incorporated vs Super Micro Computer, Inc.
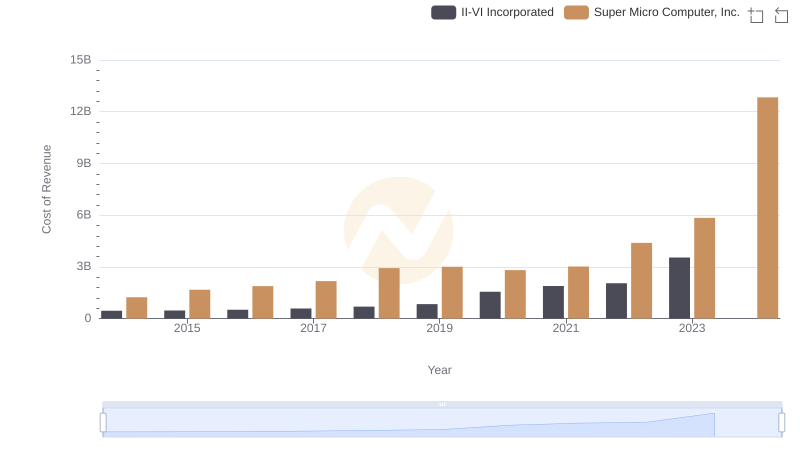
Cost of Revenue Comparison: II-VI Incorporated vs Super Micro Computer, Inc.
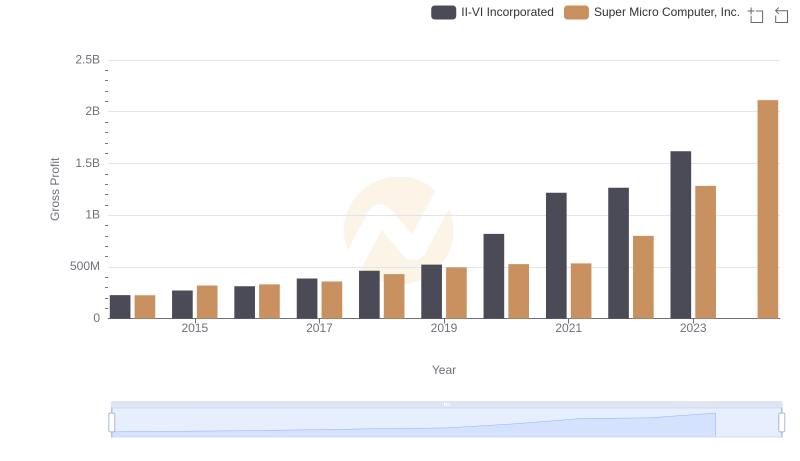
Gross Profit Trends Compared: II-VI Incorporated vs Super Micro Computer, Inc.
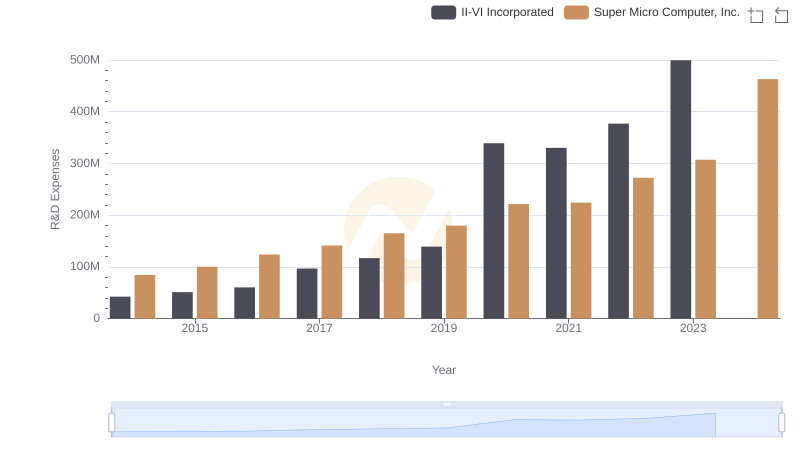
Research and Development Investment: II-VI Incorporated vs Super Micro Computer, Inc.
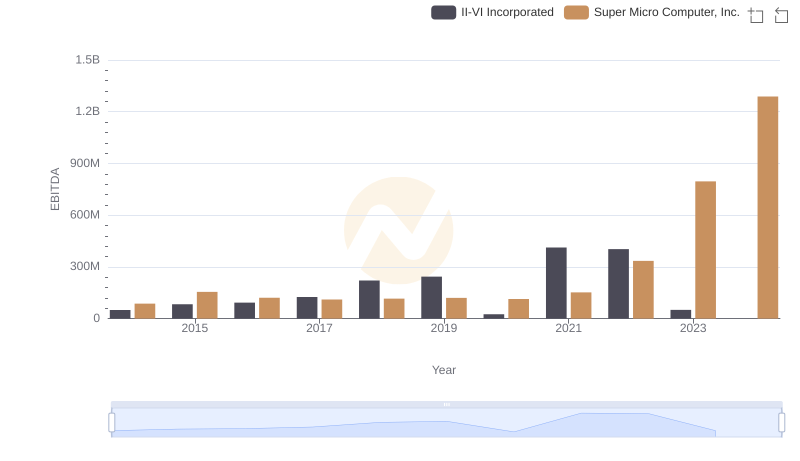
A Side-by-Side Analysis of EBITDA: II-VI Incorporated and Super Micro Computer, Inc.