| __timestamp | II-VI Incorporated | Super Micro Computer, Inc. |
|---|---|---|
| Wednesday, January 1, 2014 | 456545000 | 1241657000 |
| Thursday, January 1, 2015 | 470363000 | 1670924000 |
| Friday, January 1, 2016 | 514403000 | 1884048000 |
| Sunday, January 1, 2017 | 583693000 | 2171349000 |
| Monday, January 1, 2018 | 696591000 | 2930498000 |
| Tuesday, January 1, 2019 | 841147000 | 3004838000 |
| Wednesday, January 1, 2020 | 1560521000 | 2813071000 |
| Friday, January 1, 2021 | 1889678000 | 3022884000 |
| Saturday, January 1, 2022 | 2051120000 | 4396098000 |
| Sunday, January 1, 2023 | 3541817000 | 5840470000 |
| Monday, January 1, 2024 | 3251724000 | 12831125000 |
Igniting the spark of knowledge
In the ever-evolving landscape of technology, understanding the financial dynamics of industry leaders is crucial. This chart offers a fascinating glimpse into the cost of revenue trends for II-VI Incorporated and Super Micro Computer, Inc. over the past decade.
From 2014 to 2023, Super Micro Computer, Inc. consistently outpaced II-VI Incorporated in cost of revenue, reflecting its expansive growth strategy. Notably, by 2023, Super Micro's cost of revenue surged to nearly 5.8 billion, marking a staggering 370% increase from 2014. In contrast, II-VI Incorporated experienced a more modest growth, with its cost of revenue peaking at approximately 3.5 billion in 2023, a 670% rise from its 2014 figures.
This data underscores the aggressive market positioning of Super Micro Computer, Inc., while II-VI Incorporated's steady growth highlights its strategic focus on sustainable expansion. Missing data for 2024 suggests an opportunity for further analysis as new financial reports emerge.
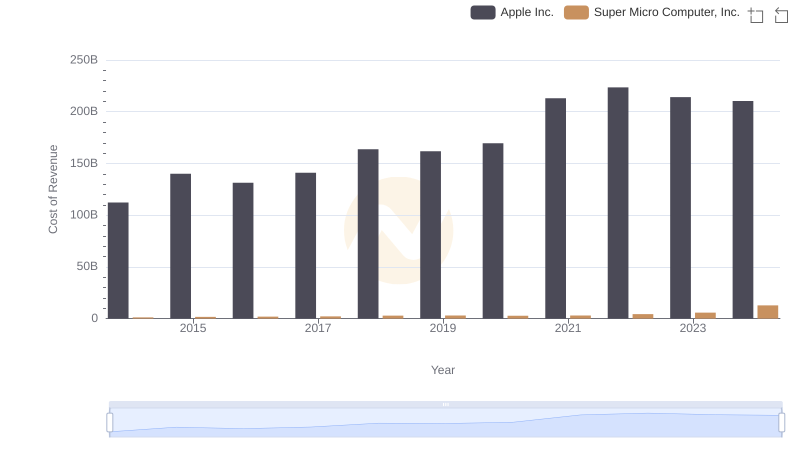
Apple Inc. vs Super Micro Computer, Inc.: Efficiency in Cost of Revenue Explored
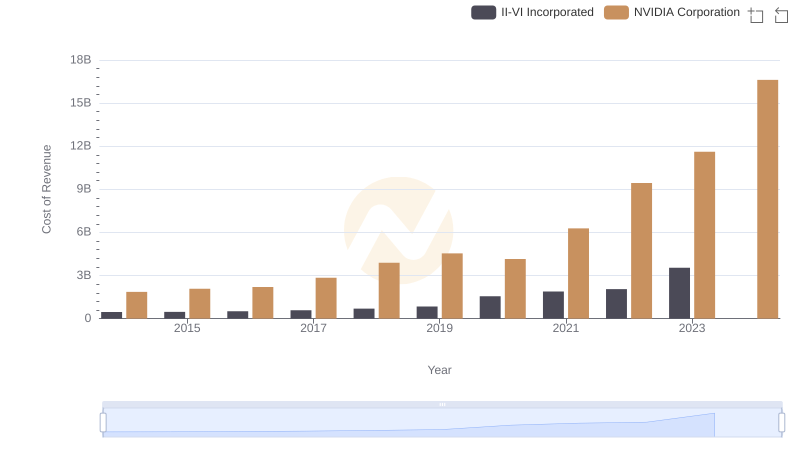
Cost of Revenue Trends: NVIDIA Corporation vs II-VI Incorporated
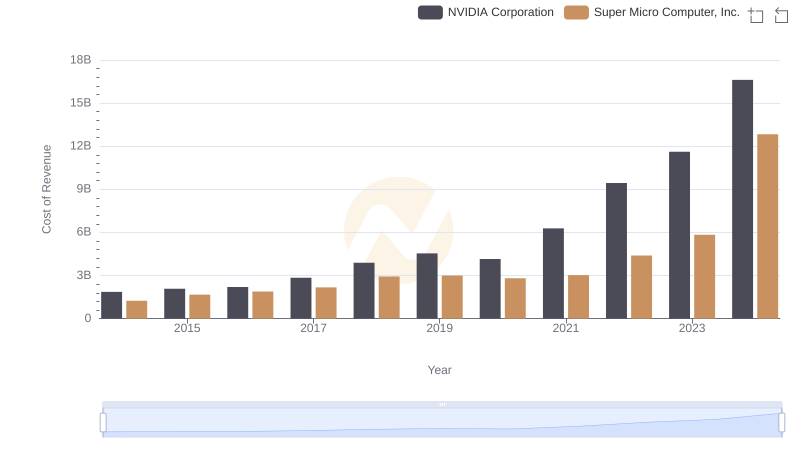
Cost of Revenue: Key Insights for NVIDIA Corporation and Super Micro Computer, Inc.
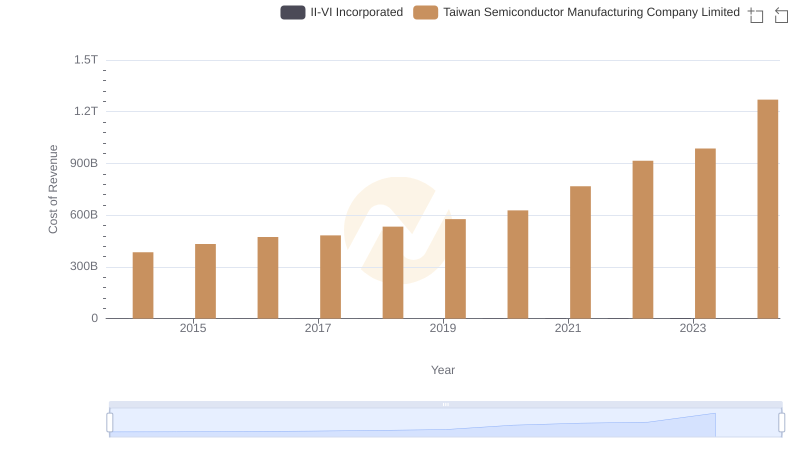
Cost of Revenue: Key Insights for Taiwan Semiconductor Manufacturing Company Limited and II-VI Incorporated
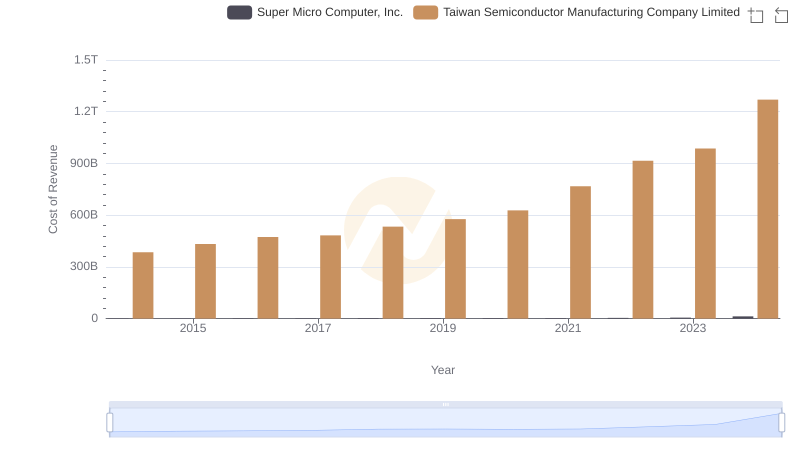
Cost Insights: Breaking Down Taiwan Semiconductor Manufacturing Company Limited and Super Micro Computer, Inc.'s Expenses
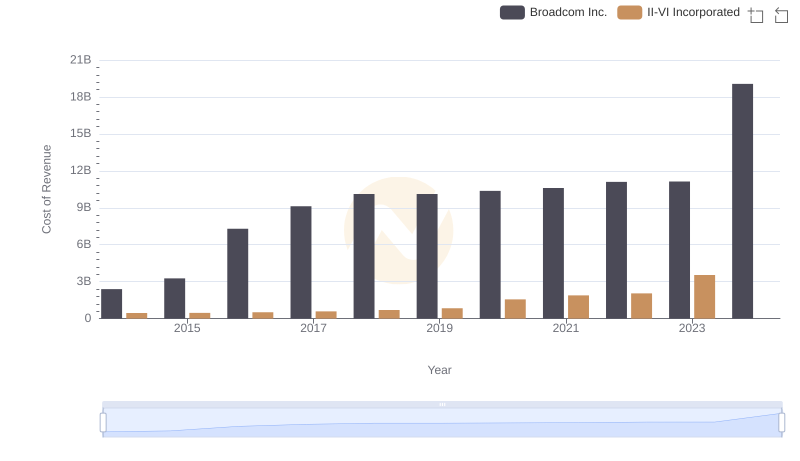
Broadcom Inc. vs II-VI Incorporated: Efficiency in Cost of Revenue Explored
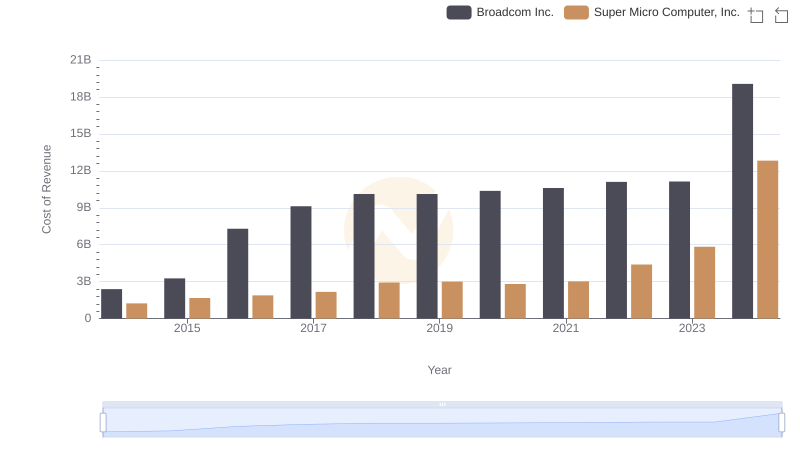
Cost of Revenue Comparison: Broadcom Inc. vs Super Micro Computer, Inc.
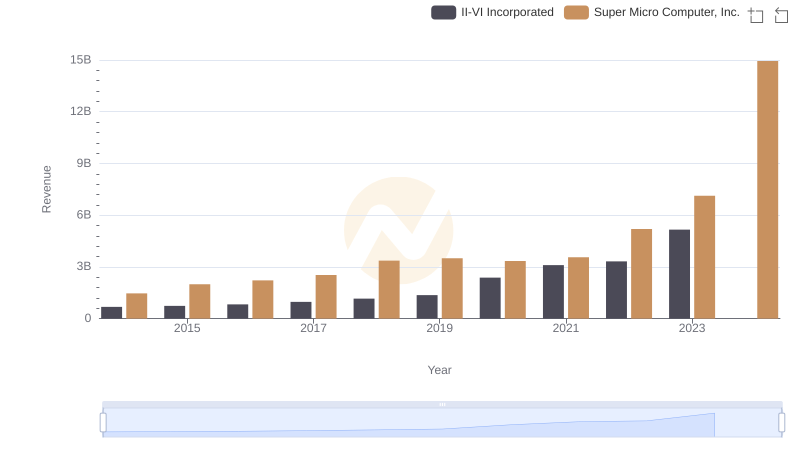
Annual Revenue Comparison: II-VI Incorporated vs Super Micro Computer, Inc.
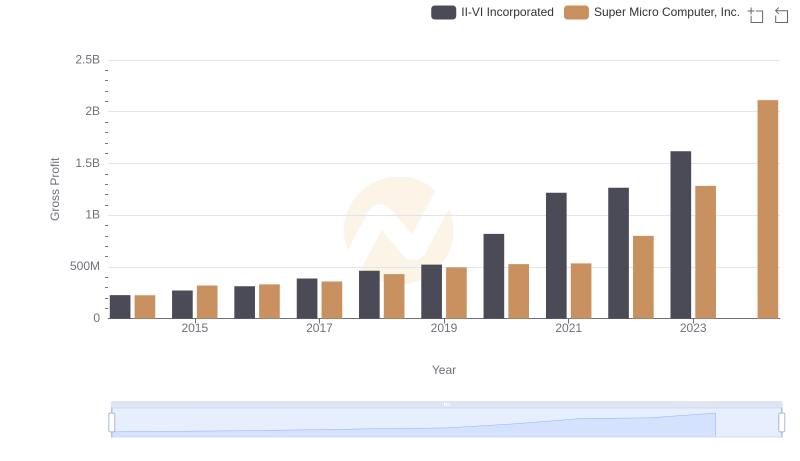
Gross Profit Trends Compared: II-VI Incorporated vs Super Micro Computer, Inc.
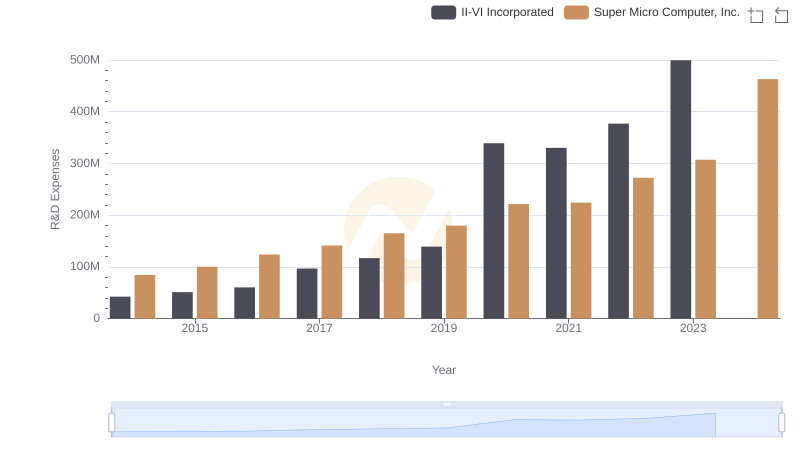
Research and Development Investment: II-VI Incorporated vs Super Micro Computer, Inc.
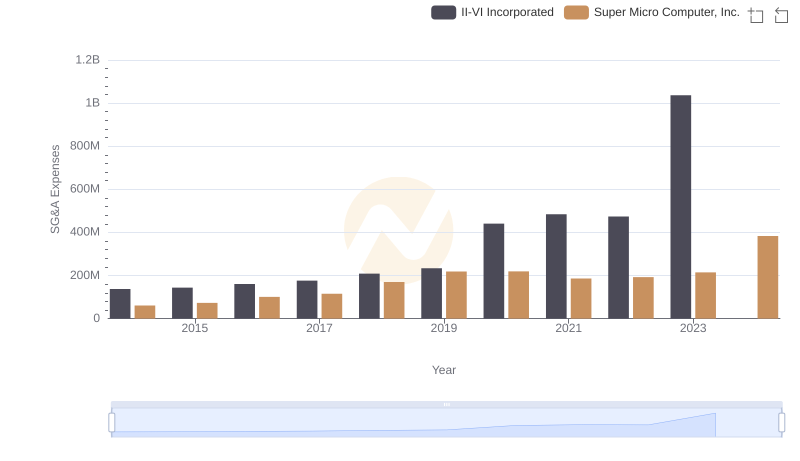
II-VI Incorporated and Super Micro Computer, Inc.: SG&A Spending Patterns Compared
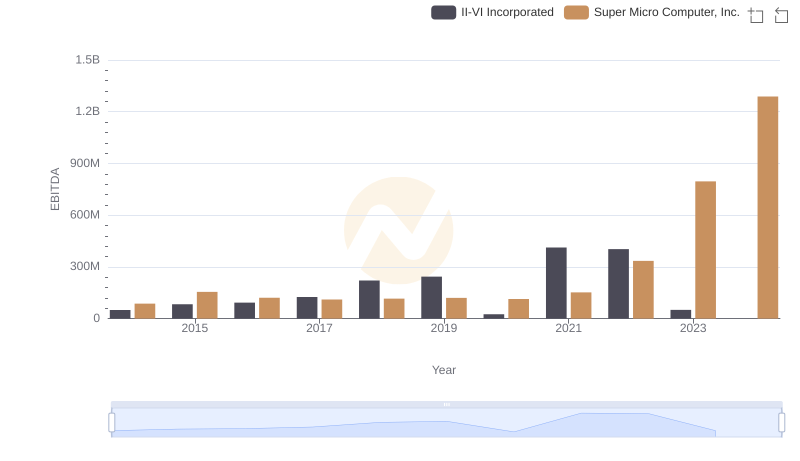
A Side-by-Side Analysis of EBITDA: II-VI Incorporated and Super Micro Computer, Inc.