| __timestamp | Dover Corporation | Global Payments Inc. |
|---|---|---|
| Wednesday, January 1, 2014 | 2974249000 | 1751611000 |
| Thursday, January 1, 2015 | 2568144000 | 1750511000 |
| Friday, January 1, 2016 | 2471969000 | 1767444000 |
| Sunday, January 1, 2017 | 2890377000 | 2047126000 |
| Monday, January 1, 2018 | 2559556000 | 2271352000 |
| Tuesday, January 1, 2019 | 2620938000 | 2838089000 |
| Wednesday, January 1, 2020 | 2474019000 | 3772831000 |
| Friday, January 1, 2021 | 2969786000 | 4750037000 |
| Saturday, January 1, 2022 | 3063556000 | 5196898000 |
| Sunday, January 1, 2023 | 3084633000 | 5926898000 |
| Monday, January 1, 2024 | 2958621000 | 6345778000 |
Infusing magic into the data realm
In the ever-evolving landscape of global commerce, understanding the financial health of industry leaders is crucial. Over the past decade, Global Payments Inc. and Dover Corporation have showcased intriguing trends in their gross profits. From 2014 to 2023, Global Payments Inc. has seen a remarkable growth of over 238%, with its gross profit soaring from approximately $1.75 billion to nearly $5.93 billion. This growth reflects the company's strategic expansions and technological advancements in the payment processing sector.
On the other hand, Dover Corporation, a stalwart in diversified industrial products, has experienced a steadier increase of around 4% in the same period, with gross profits rising from $2.97 billion to $3.08 billion. This stability underscores Dover's consistent performance and resilience in a competitive market.
These trends highlight the dynamic nature of the global economy and the diverse strategies companies employ to thrive.
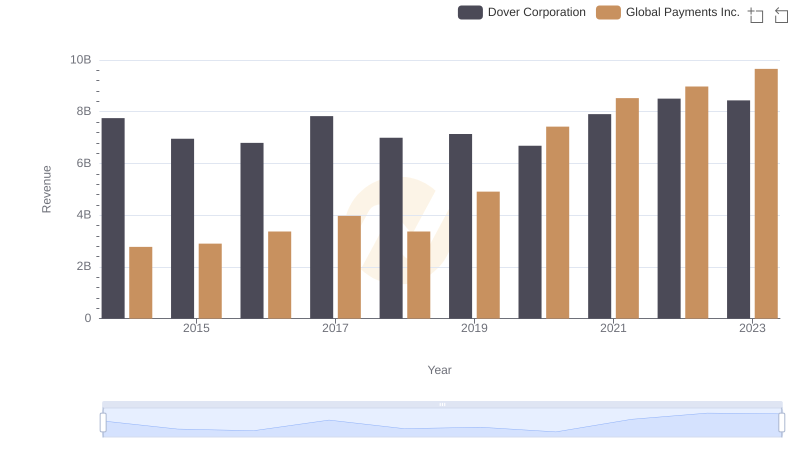
Breaking Down Revenue Trends: Global Payments Inc. vs Dover Corporation
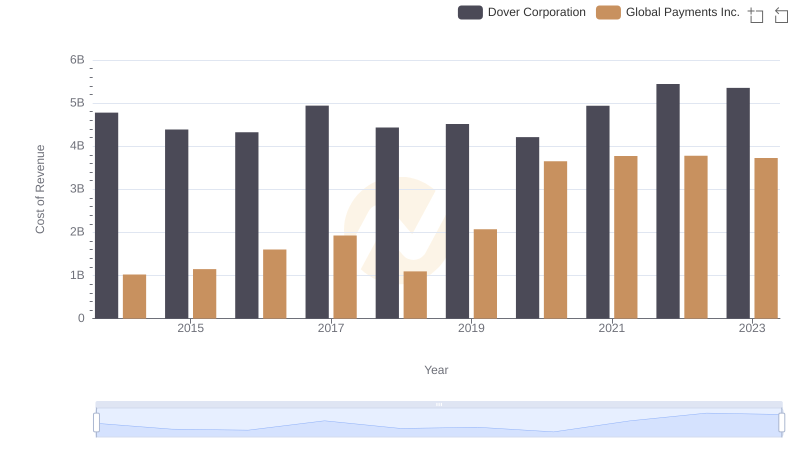
Comparing Cost of Revenue Efficiency: Global Payments Inc. vs Dover Corporation
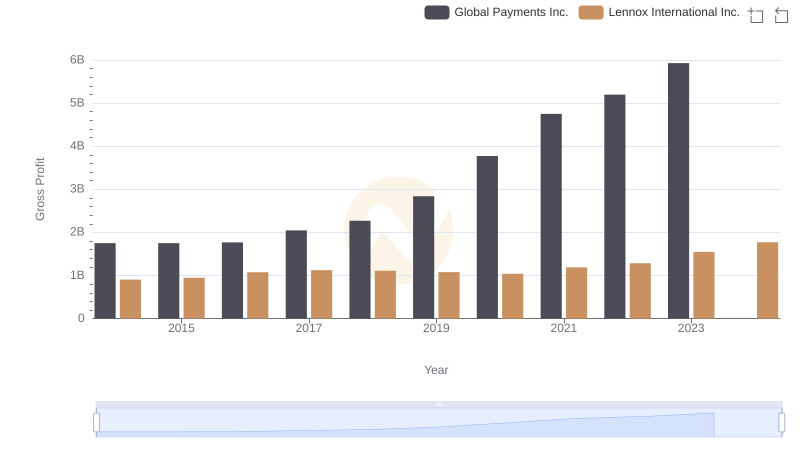
Key Insights on Gross Profit: Global Payments Inc. vs Lennox International Inc.
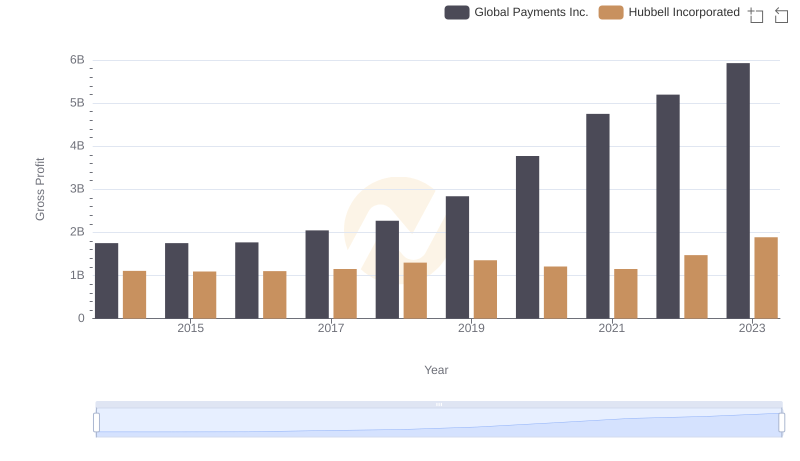
Gross Profit Comparison: Global Payments Inc. and Hubbell Incorporated Trends
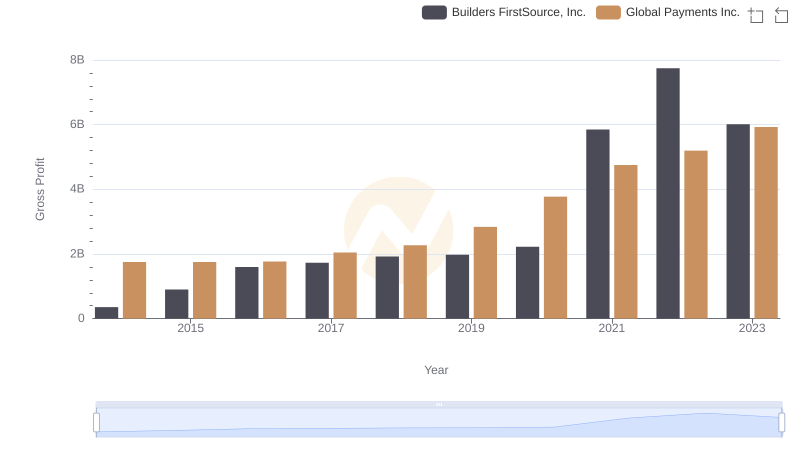
Who Generates Higher Gross Profit? Global Payments Inc. or Builders FirstSource, Inc.
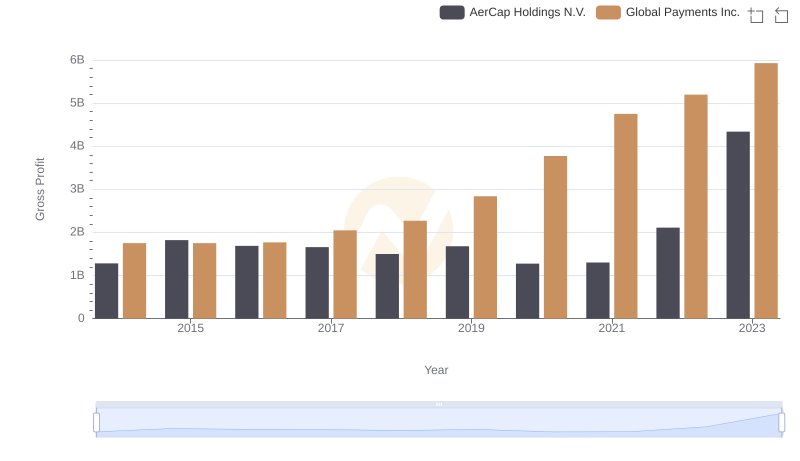
Gross Profit Comparison: Global Payments Inc. and AerCap Holdings N.V. Trends
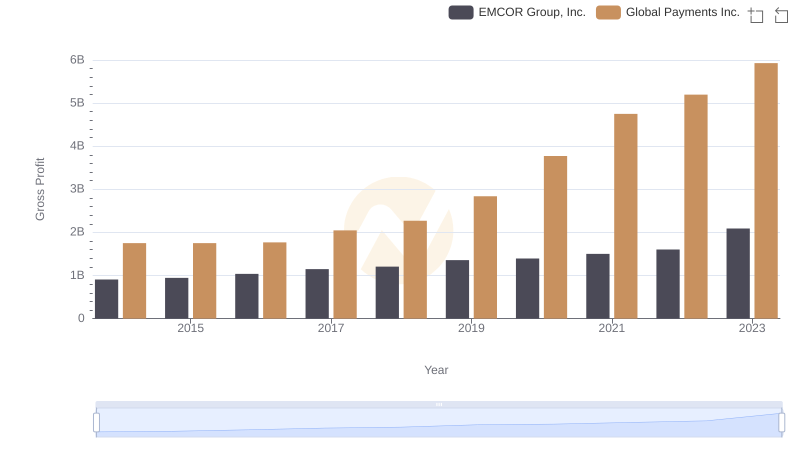
Key Insights on Gross Profit: Global Payments Inc. vs EMCOR Group, Inc.
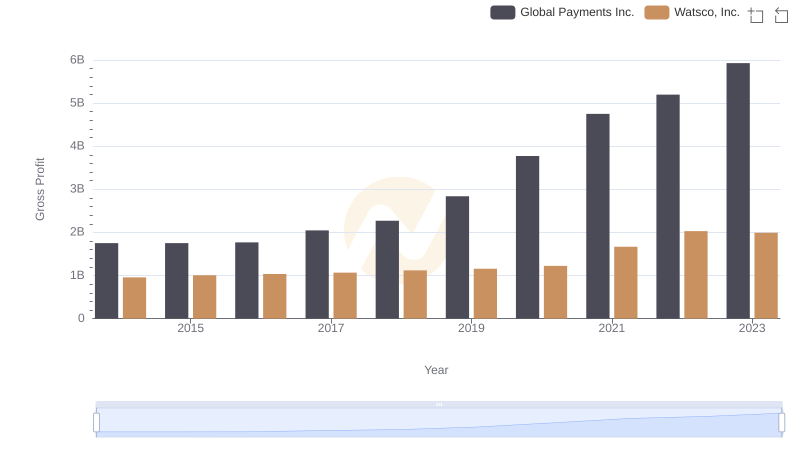
Gross Profit Comparison: Global Payments Inc. and Watsco, Inc. Trends