| __timestamp | Eaton Corporation plc | Norfolk Southern Corporation |
|---|---|---|
| Wednesday, January 1, 2014 | 6906000000 | 4515000000 |
| Thursday, January 1, 2015 | 6563000000 | 3860000000 |
| Friday, January 1, 2016 | 6347000000 | 3873000000 |
| Sunday, January 1, 2017 | 6648000000 | 4327000000 |
| Monday, January 1, 2018 | 7098000000 | 4614000000 |
| Tuesday, January 1, 2019 | 7052000000 | 4729000000 |
| Wednesday, January 1, 2020 | 5450000000 | 4040000000 |
| Friday, January 1, 2021 | 6335000000 | 4994000000 |
| Saturday, January 1, 2022 | 6887000000 | 5522000000 |
| Sunday, January 1, 2023 | 8433000000 | 5382000000 |
| Monday, January 1, 2024 | 9503000000 | 4543000000 |
Unleashing the power of data
In the ever-evolving landscape of American industry, Eaton Corporation plc and Norfolk Southern Corporation stand as titans in their respective fields. Over the past decade, from 2014 to 2023, Eaton Corporation has demonstrated a robust growth trajectory in gross profit, peaking in 2023 with a remarkable 22% increase from its 2014 figures. This growth underscores Eaton's strategic prowess in the industrial sector.
Conversely, Norfolk Southern Corporation, a leader in the transportation industry, has shown a steady upward trend, with a notable 22% rise in gross profit from 2014 to 2022. Despite a slight dip in 2023, Norfolk Southern's resilience in the face of economic challenges is evident.
These trends highlight the dynamic nature of industrial and transportation sectors, offering valuable insights for investors and industry analysts alike.
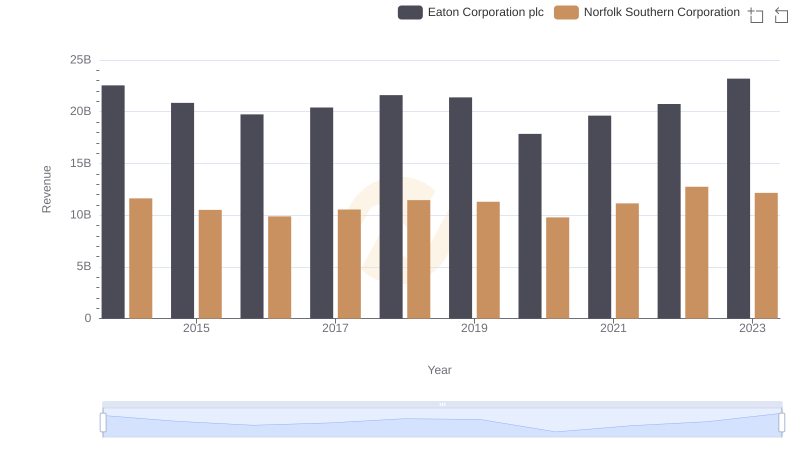
Breaking Down Revenue Trends: Eaton Corporation plc vs Norfolk Southern Corporation
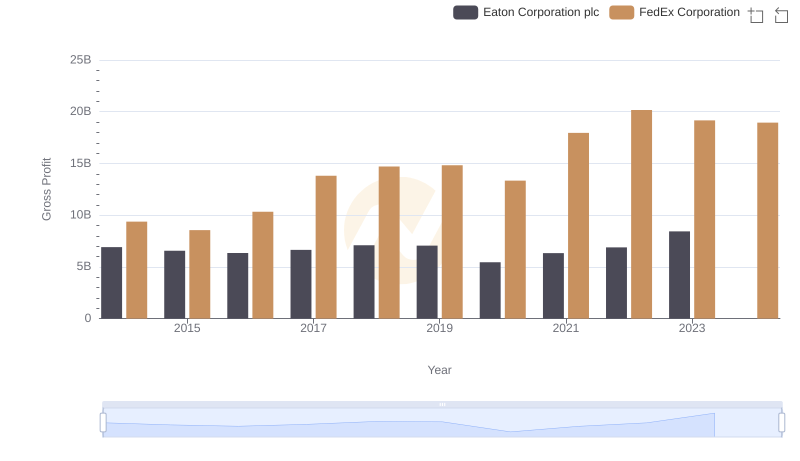
Key Insights on Gross Profit: Eaton Corporation plc vs FedEx Corporation
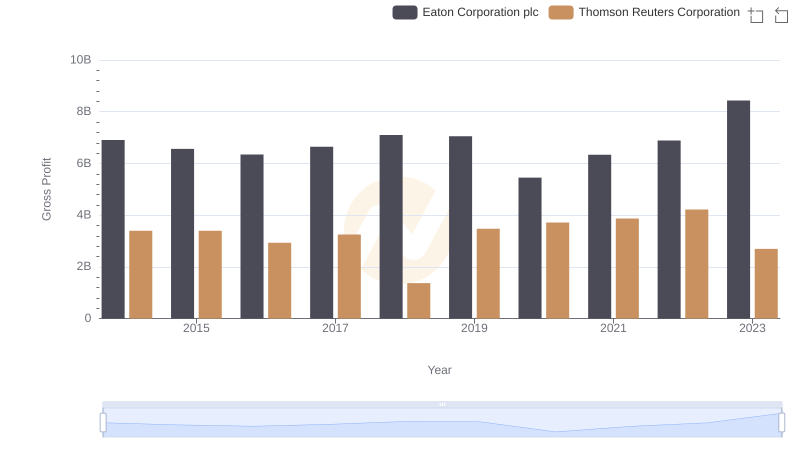
Eaton Corporation plc and Thomson Reuters Corporation: A Detailed Gross Profit Analysis
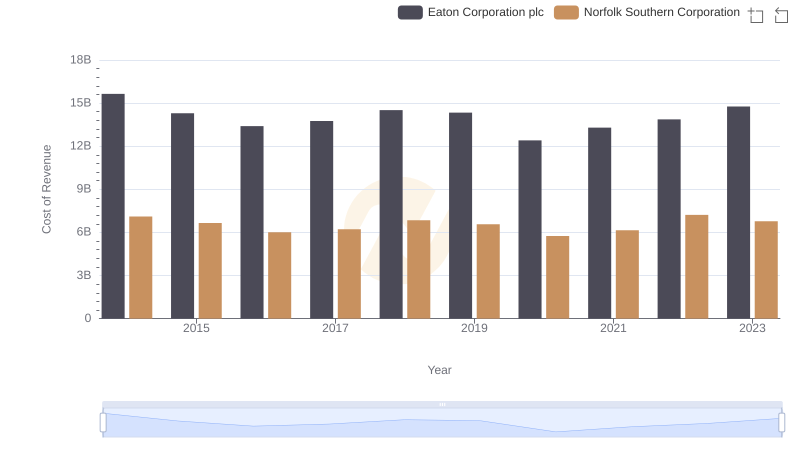
Cost of Revenue Comparison: Eaton Corporation plc vs Norfolk Southern Corporation
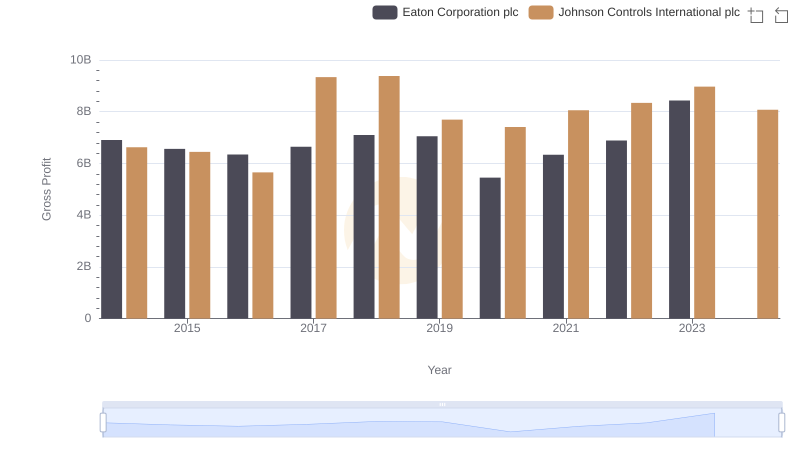
Gross Profit Trends Compared: Eaton Corporation plc vs Johnson Controls International plc