| __timestamp | Eaton Corporation plc | Norfolk Southern Corporation |
|---|---|---|
| Wednesday, January 1, 2014 | 15646000000 | 7109000000 |
| Thursday, January 1, 2015 | 14292000000 | 6651000000 |
| Friday, January 1, 2016 | 13400000000 | 6015000000 |
| Sunday, January 1, 2017 | 13756000000 | 6224000000 |
| Monday, January 1, 2018 | 14511000000 | 6844000000 |
| Tuesday, January 1, 2019 | 14338000000 | 6567000000 |
| Wednesday, January 1, 2020 | 12408000000 | 5749000000 |
| Friday, January 1, 2021 | 13293000000 | 6148000000 |
| Saturday, January 1, 2022 | 13865000000 | 7223000000 |
| Sunday, January 1, 2023 | 14763000000 | 6774000000 |
| Monday, January 1, 2024 | 15375000000 | 7580000000 |
Igniting the spark of knowledge
In the ever-evolving landscape of industrial and transportation sectors, Eaton Corporation plc and Norfolk Southern Corporation stand as titans. Over the past decade, Eaton's cost of revenue has shown a dynamic trend, peaking in 2014 and 2023, with a notable dip in 2020, reflecting a 21% decrease from its 2014 high. Meanwhile, Norfolk Southern's cost of revenue has been relatively stable, with a slight decline in 2020, marking a 19% drop from its 2014 figures.
From 2014 to 2023, Eaton's cost of revenue averaged around $14 billion, while Norfolk Southern maintained an average of approximately $6.5 billion. The data reveals Eaton's resilience and adaptability, bouncing back post-2020, while Norfolk Southern's steady approach underscores its strategic consistency. This comparison offers a fascinating glimpse into how these corporations navigate economic shifts and industry challenges.
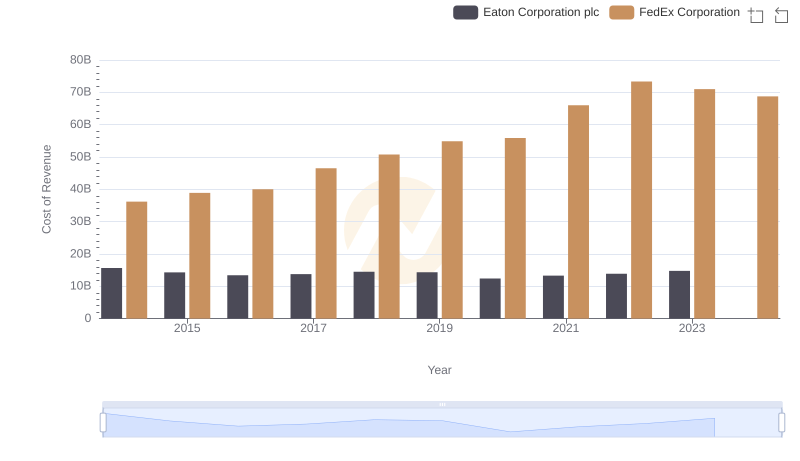
Comparing Cost of Revenue Efficiency: Eaton Corporation plc vs FedEx Corporation
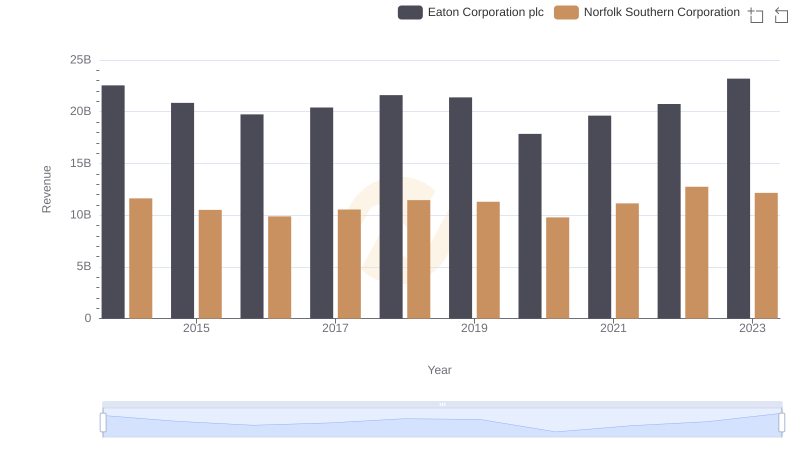
Breaking Down Revenue Trends: Eaton Corporation plc vs Norfolk Southern Corporation
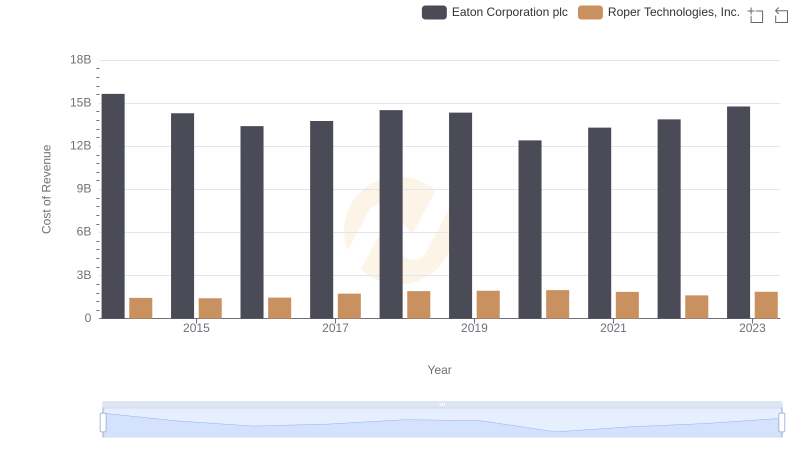
Comparing Cost of Revenue Efficiency: Eaton Corporation plc vs Roper Technologies, Inc.
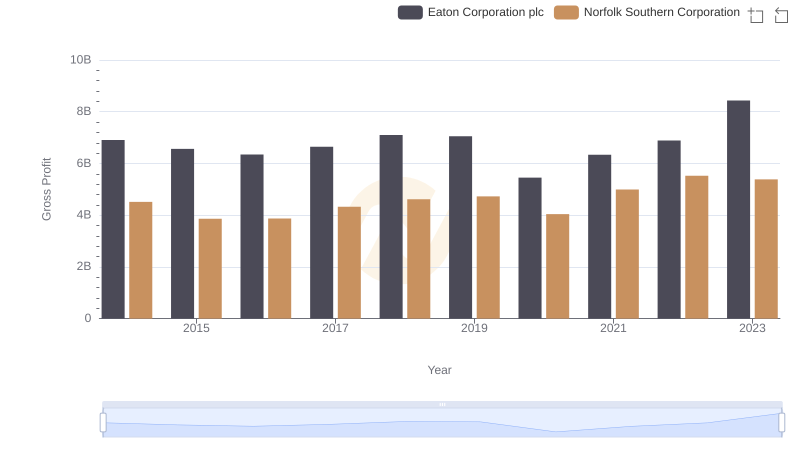
Gross Profit Trends Compared: Eaton Corporation plc vs Norfolk Southern Corporation