| __timestamp | Comfort Systems USA, Inc. | Eaton Corporation plc |
|---|---|---|
| Wednesday, January 1, 2014 | 249771000 | 6906000000 |
| Thursday, January 1, 2015 | 318129000 | 6563000000 |
| Friday, January 1, 2016 | 344009000 | 6347000000 |
| Sunday, January 1, 2017 | 366281000 | 6648000000 |
| Monday, January 1, 2018 | 446279000 | 7098000000 |
| Tuesday, January 1, 2019 | 501943000 | 7052000000 |
| Wednesday, January 1, 2020 | 546983000 | 5450000000 |
| Friday, January 1, 2021 | 563207000 | 6335000000 |
| Saturday, January 1, 2022 | 741608000 | 6887000000 |
| Sunday, January 1, 2023 | 990509000 | 8433000000 |
| Monday, January 1, 2024 | 9503000000 |
Igniting the spark of knowledge
In the ever-evolving landscape of industrial and building services, Eaton Corporation plc and Comfort Systems USA, Inc. have shown distinct trajectories in their gross profit trends over the past decade. From 2014 to 2023, Eaton Corporation's gross profit has consistently outpaced Comfort Systems USA, with Eaton's figures peaking at approximately $8.4 billion in 2023, marking a 22% increase from its 2014 value. Meanwhile, Comfort Systems USA has demonstrated impressive growth, with its gross profit nearly quadrupling from $250 million in 2014 to just under $1 billion in 2023. This remarkable 296% growth underscores the company's expanding footprint in the building services sector. As we look to the future, these trends highlight the dynamic nature of the industry and the strategic maneuvers companies must undertake to maintain competitive advantage.
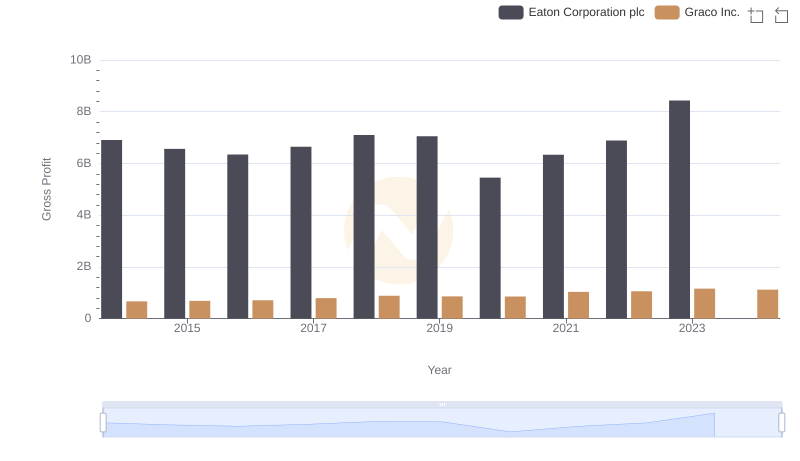
Gross Profit Comparison: Eaton Corporation plc and Graco Inc. Trends
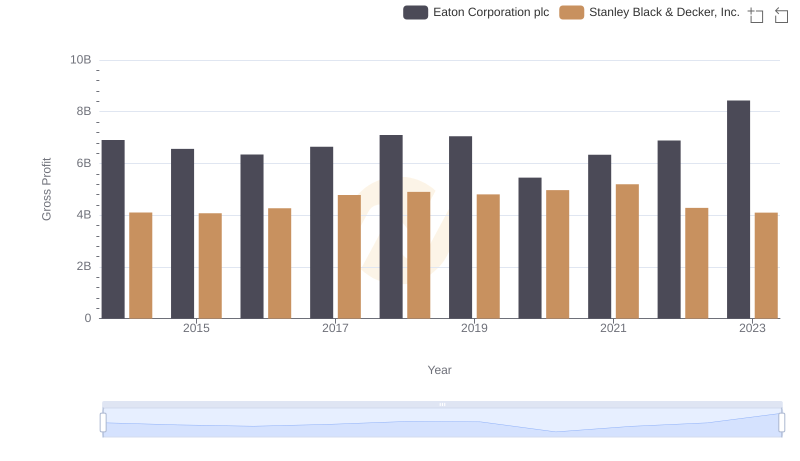
Gross Profit Trends Compared: Eaton Corporation plc vs Stanley Black & Decker, Inc.
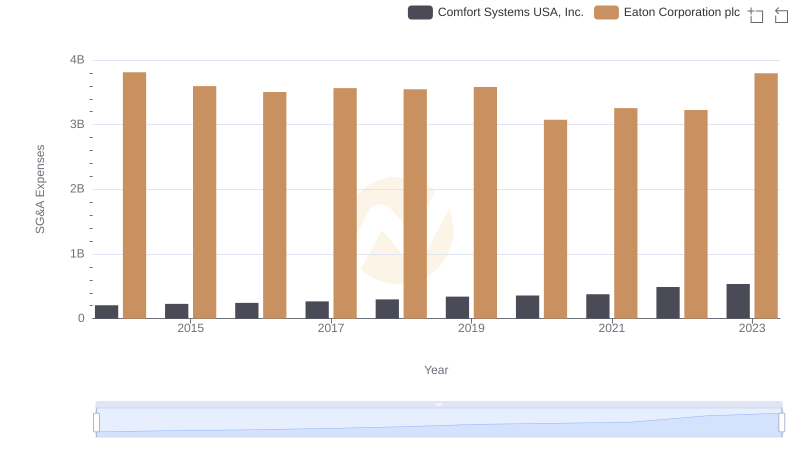
Eaton Corporation plc and Comfort Systems USA, Inc.: SG&A Spending Patterns Compared
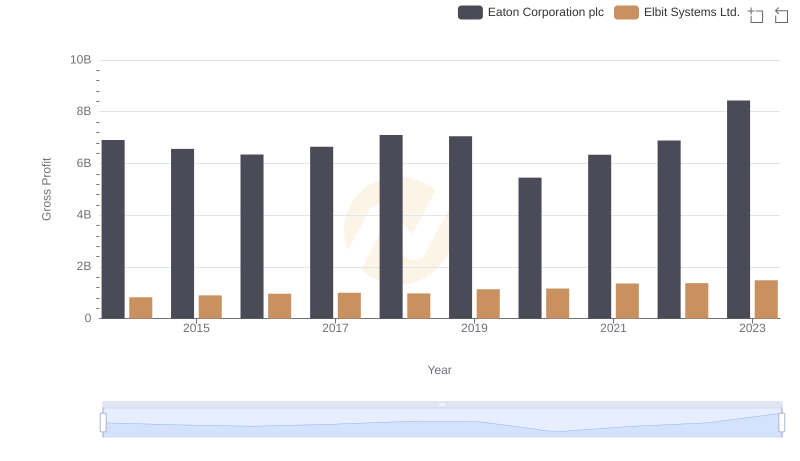
Key Insights on Gross Profit: Eaton Corporation plc vs Elbit Systems Ltd.

EBITDA Metrics Evaluated: Eaton Corporation plc vs Comfort Systems USA, Inc.