| __timestamp | Eaton Corporation plc | Graco Inc. |
|---|---|---|
| Wednesday, January 1, 2014 | 6906000000 | 666736000 |
| Thursday, January 1, 2015 | 6563000000 | 684700000 |
| Friday, January 1, 2016 | 6347000000 | 708239000 |
| Sunday, January 1, 2017 | 6648000000 | 793049000 |
| Monday, January 1, 2018 | 7098000000 | 882539000 |
| Tuesday, January 1, 2019 | 7052000000 | 859756000 |
| Wednesday, January 1, 2020 | 5450000000 | 854937000 |
| Friday, January 1, 2021 | 6335000000 | 1033949000 |
| Saturday, January 1, 2022 | 6887000000 | 1057439000 |
| Sunday, January 1, 2023 | 8433000000 | 1161021000 |
| Monday, January 1, 2024 | 9503000000 | 1122461000 |
Unleashing the power of data
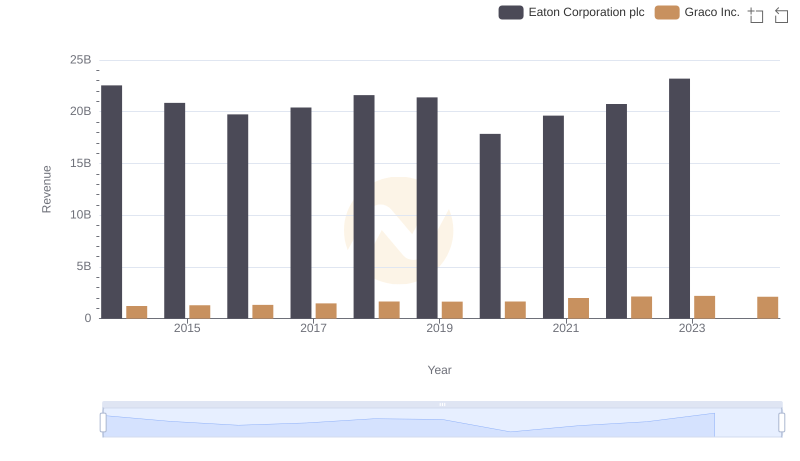
In the ever-evolving landscape of industrial manufacturing, Eaton Corporation plc and Graco Inc. have showcased intriguing financial trajectories over the past decade. From 2014 to 2023, Eaton's gross profit exhibited a robust growth of approximately 22%, peaking in 2023. This upward trend underscores Eaton's strategic prowess in navigating market challenges and capitalizing on opportunities. Meanwhile, Graco Inc. demonstrated a steady increase in gross profit, with a notable 74% rise over the same period, reflecting its resilience and adaptability in a competitive market.
The year 2020 marked a significant dip for Eaton, with gross profit dropping to its lowest point, likely due to global economic disruptions. However, Eaton's remarkable recovery by 2023 highlights its strong market position. Graco, on the other hand, maintained a consistent upward trajectory, showcasing its ability to sustain growth even amidst economic uncertainties. This comparison offers valuable insights into the financial health and strategic direction of these industrial giants.