| __timestamp | Comfort Systems USA, Inc. | Eaton Corporation plc |
|---|---|---|
| Wednesday, January 1, 2014 | 63455000 | 3586000000 |
| Thursday, January 1, 2015 | 112580000 | 3302000000 |
| Friday, January 1, 2016 | 126974000 | 3176000000 |
| Sunday, January 1, 2017 | 137151000 | 3418000000 |
| Monday, January 1, 2018 | 191982000 | 3875000000 |
| Tuesday, January 1, 2019 | 229518000 | 2827000000 |
| Wednesday, January 1, 2020 | 276904000 | 1674000000 |
| Friday, January 1, 2021 | 282506000 | 2423000000 |
| Saturday, January 1, 2022 | 352446000 | 3031000000 |
| Sunday, January 1, 2023 | 497652000 | 4904000000 |
| Monday, January 1, 2024 | 5547999771 |
Unleashing the power of data
In the ever-evolving landscape of industrial and building systems, Eaton Corporation plc and Comfort Systems USA, Inc. have emerged as formidable players. Over the past decade, Eaton has consistently outperformed Comfort Systems in terms of EBITDA, showcasing a robust growth trajectory. From 2014 to 2023, Eaton's EBITDA surged by approximately 37%, peaking at nearly $4.9 billion in 2023. In contrast, Comfort Systems USA, Inc. demonstrated a remarkable growth of over 680% during the same period, albeit from a smaller base, reaching nearly $498 million in 2023.
This comparison highlights Eaton's dominance in the sector, yet Comfort Systems' rapid growth cannot be overlooked. As the industry continues to innovate, these companies' financial health will be pivotal in shaping the future of industrial solutions and building systems.
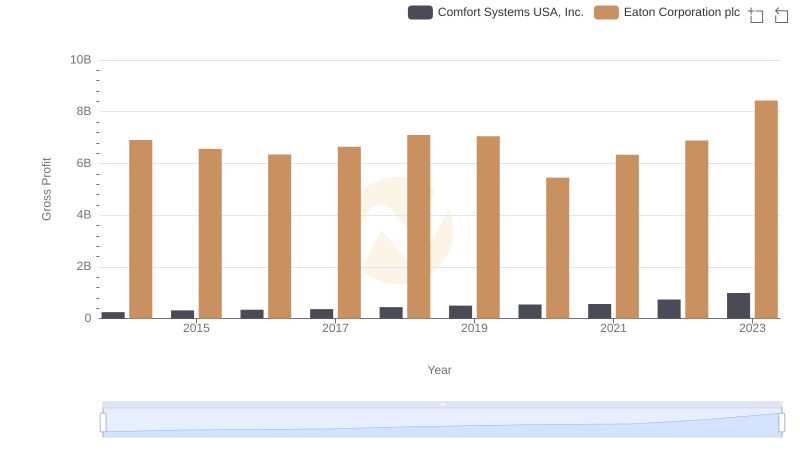
Gross Profit Trends Compared: Eaton Corporation plc vs Comfort Systems USA, Inc.
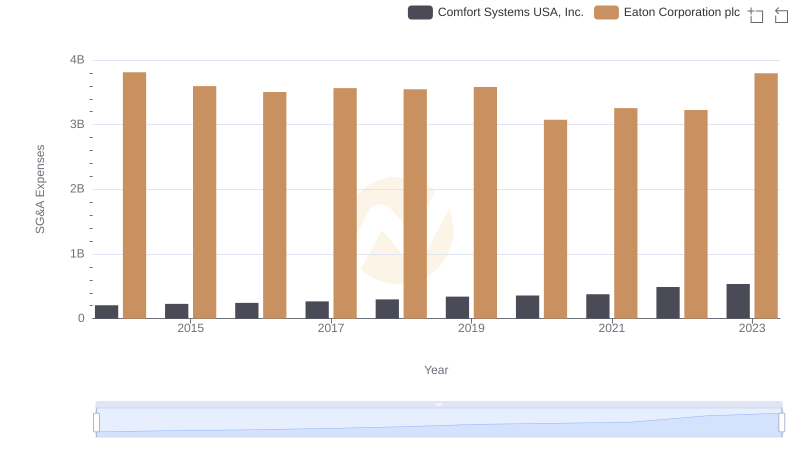
Eaton Corporation plc and Comfort Systems USA, Inc.: SG&A Spending Patterns Compared
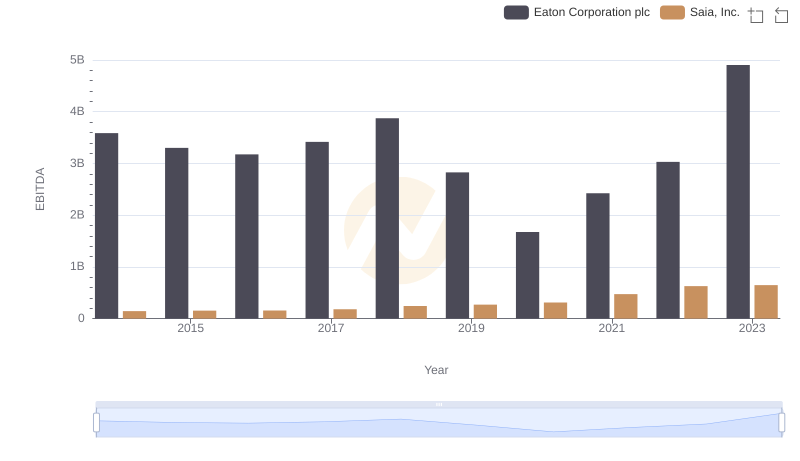
A Professional Review of EBITDA: Eaton Corporation plc Compared to Saia, Inc.
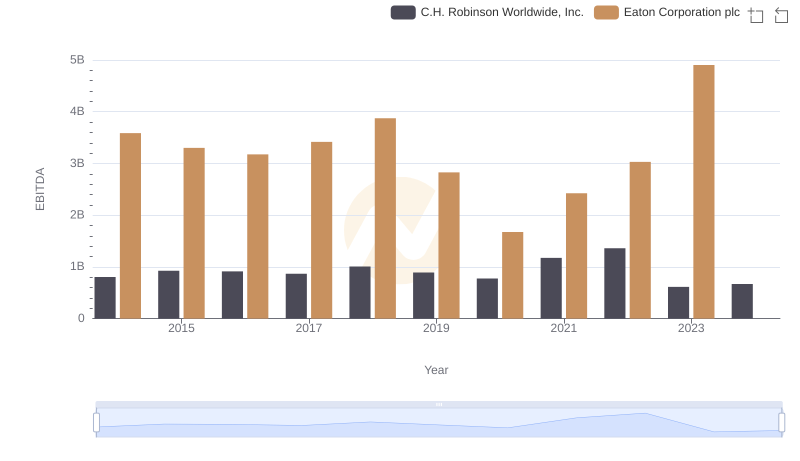
EBITDA Analysis: Evaluating Eaton Corporation plc Against C.H. Robinson Worldwide, Inc.