| __timestamp | Cadence Design Systems, Inc. | Corpay, Inc. |
|---|---|---|
| Wednesday, January 1, 2014 | 1357226000 | 929799000 |
| Thursday, January 1, 2015 | 1463638000 | 1263535000 |
| Friday, January 1, 2016 | 1559591000 | 1209581000 |
| Sunday, January 1, 2017 | 1705642000 | 1493201000 |
| Monday, January 1, 2018 | 1879275000 | 1740908000 |
| Tuesday, January 1, 2019 | 2069962000 | 1922804000 |
| Wednesday, January 1, 2020 | 2377393000 | 1792492000 |
| Friday, January 1, 2021 | 2681238000 | 2273917000 |
| Saturday, January 1, 2022 | 3190095000 | 2662422000 |
| Sunday, January 1, 2023 | 3654945000 | 2937811000 |
| Monday, January 1, 2024 | 4430362000 | 3974589000 |
In pursuit of knowledge
In the ever-evolving landscape of technology and finance, Cadence Design Systems, Inc. and Corpay, Inc. have demonstrated remarkable growth over the past decade. From 2014 to 2023, Cadence Design Systems saw its gross profit surge by approximately 169%, while Corpay, Inc. experienced a robust increase of around 216%. This impressive growth trajectory highlights the resilience and strategic prowess of both companies in navigating market challenges.
Cadence Design Systems, a leader in electronic design automation, has consistently expanded its market share, reflecting a compound annual growth rate (CAGR) of about 12%. Meanwhile, Corpay, a key player in financial technology, has capitalized on the digital transformation wave, achieving a CAGR of nearly 14%.
As we look to the future, these trends underscore the dynamic nature of the industry and the potential for continued innovation and expansion.
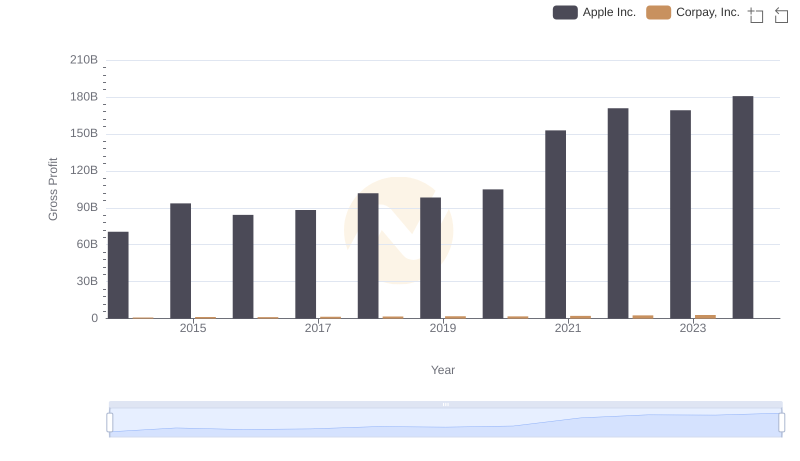
Apple Inc. vs Corpay, Inc.: A Gross Profit Performance Breakdown
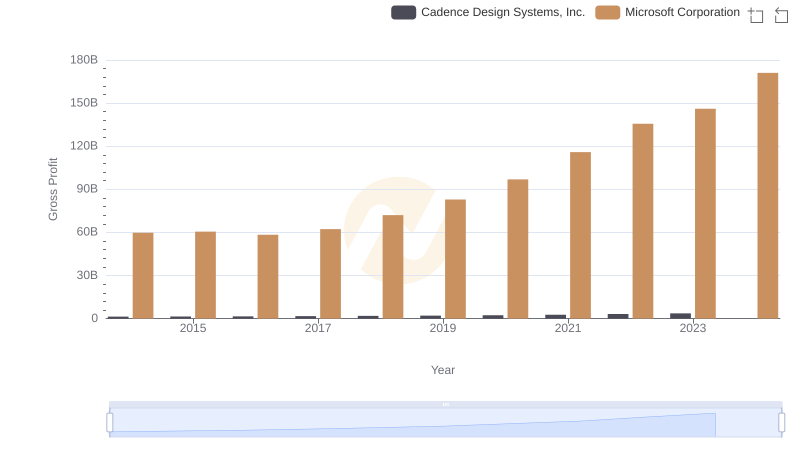
Key Insights on Gross Profit: Microsoft Corporation vs Cadence Design Systems, Inc.
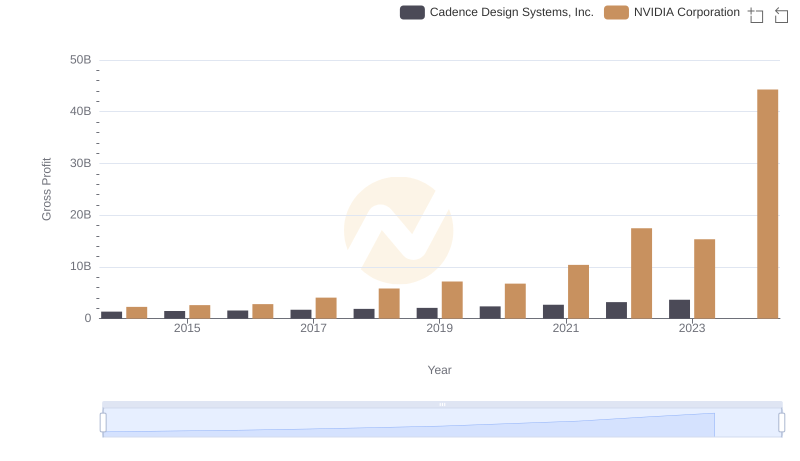
NVIDIA Corporation and Cadence Design Systems, Inc.: A Detailed Gross Profit Analysis
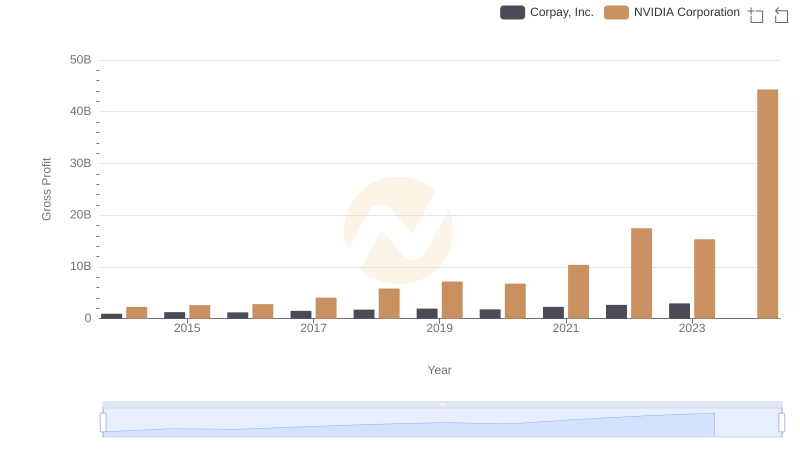
Key Insights on Gross Profit: NVIDIA Corporation vs Corpay, Inc.
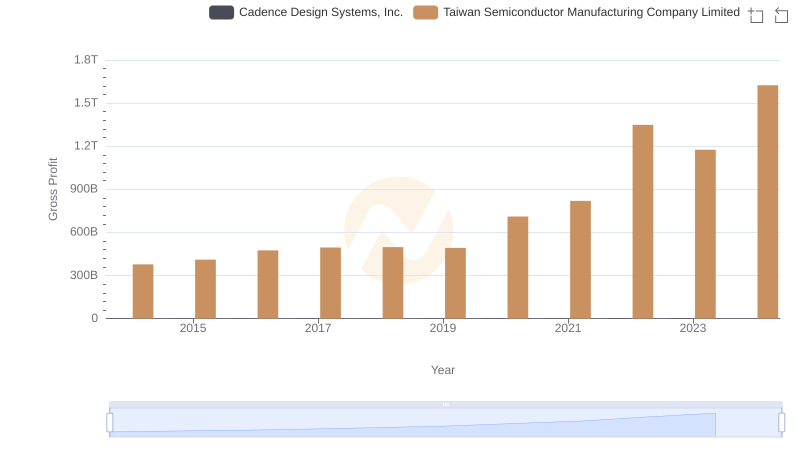
Gross Profit Trends Compared: Taiwan Semiconductor Manufacturing Company Limited vs Cadence Design Systems, Inc.
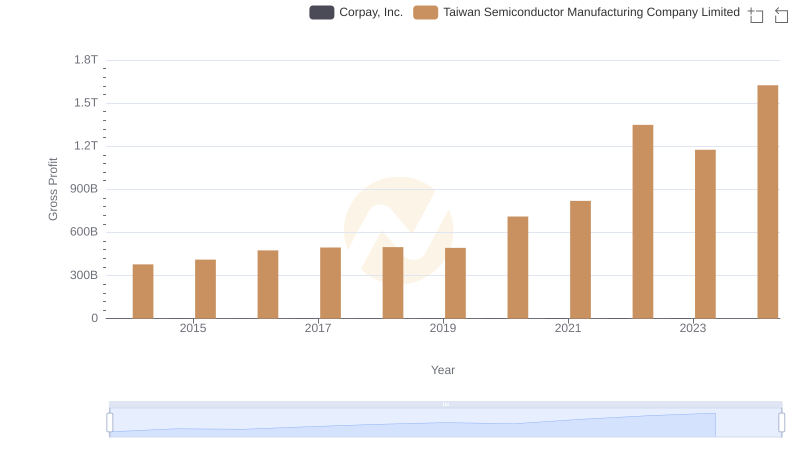
Key Insights on Gross Profit: Taiwan Semiconductor Manufacturing Company Limited vs Corpay, Inc.
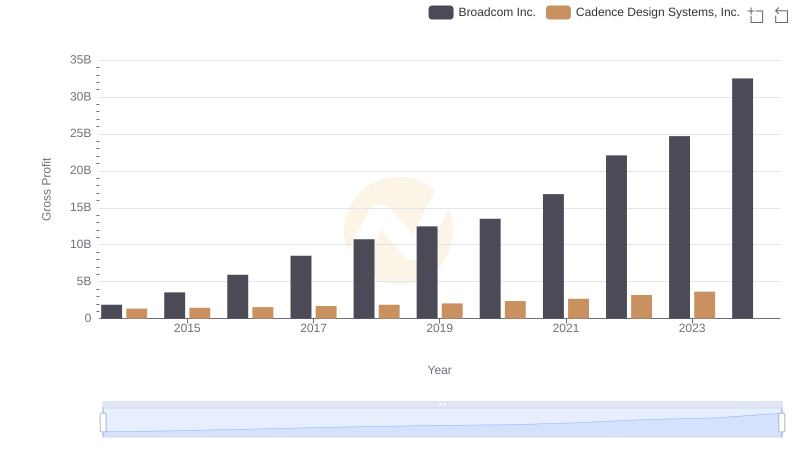
Who Generates Higher Gross Profit? Broadcom Inc. or Cadence Design Systems, Inc.
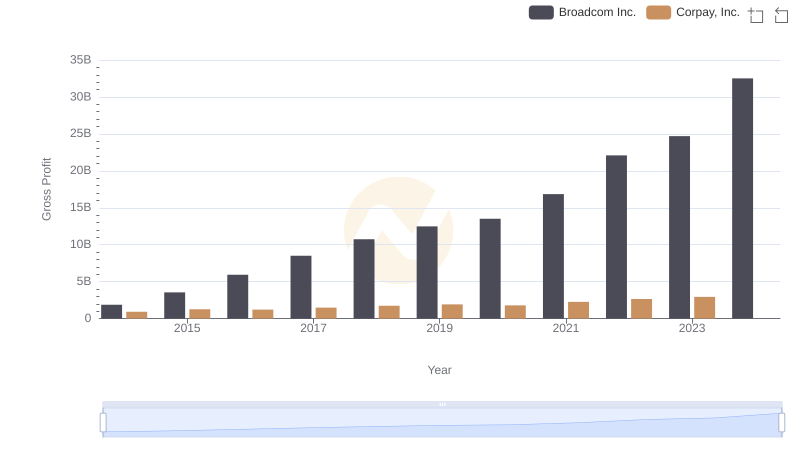
Gross Profit Comparison: Broadcom Inc. and Corpay, Inc. Trends
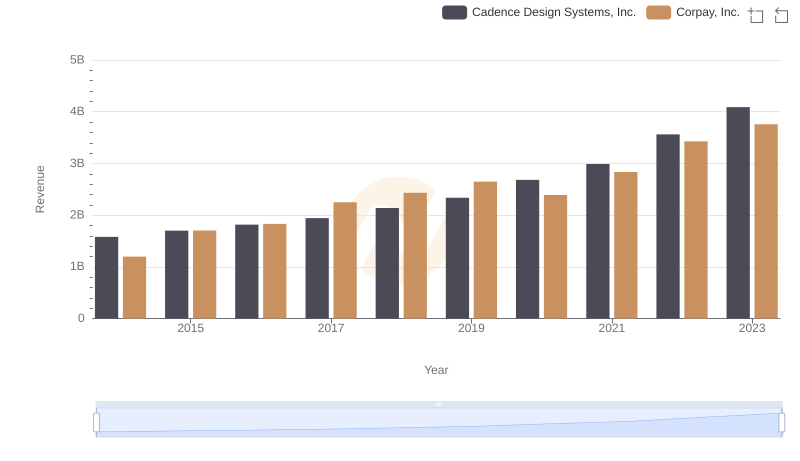
Breaking Down Revenue Trends: Cadence Design Systems, Inc. vs Corpay, Inc.
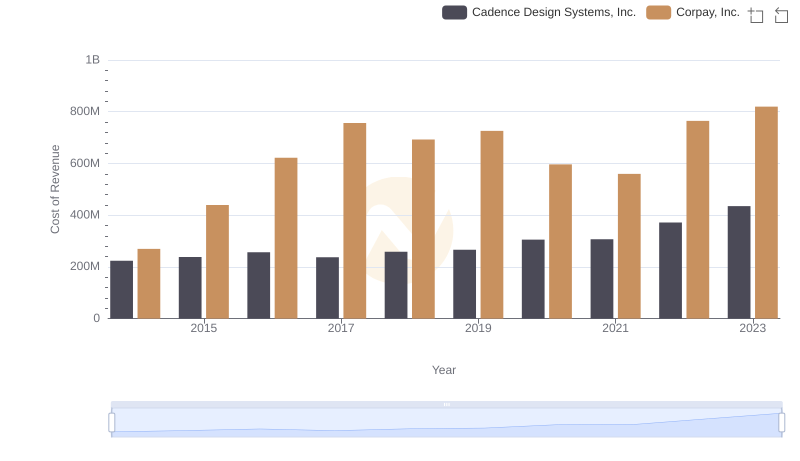
Comparing Cost of Revenue Efficiency: Cadence Design Systems, Inc. vs Corpay, Inc.
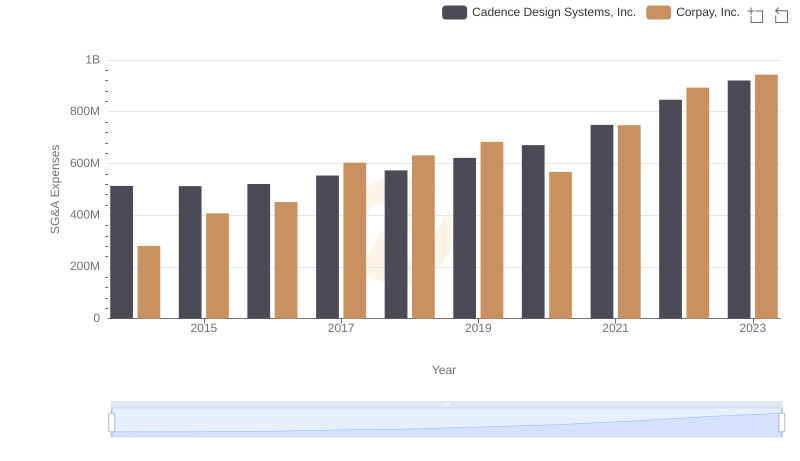
Cadence Design Systems, Inc. or Corpay, Inc.: Who Manages SG&A Costs Better?
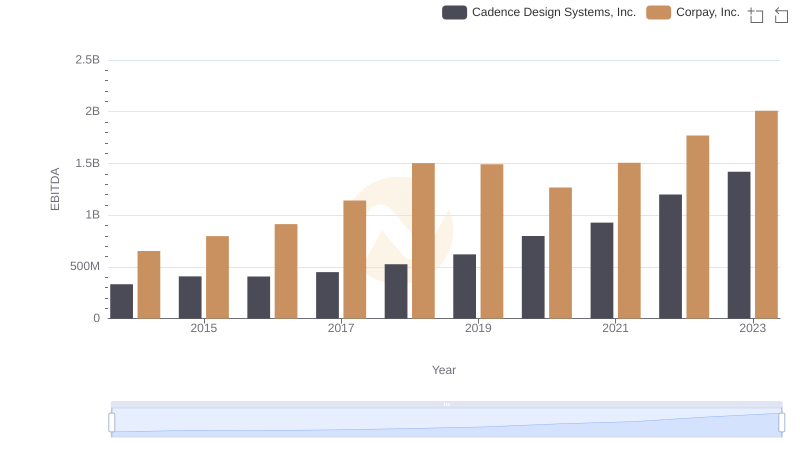
Cadence Design Systems, Inc. and Corpay, Inc.: A Detailed Examination of EBITDA Performance