| __timestamp | Cadence Design Systems, Inc. | Corpay, Inc. |
|---|---|---|
| Wednesday, January 1, 2014 | 1580932000 | 1199390000 |
| Thursday, January 1, 2015 | 1702091000 | 1702865000 |
| Friday, January 1, 2016 | 1816083000 | 1831546000 |
| Sunday, January 1, 2017 | 1943032000 | 2249538000 |
| Monday, January 1, 2018 | 2138022000 | 2433492000 |
| Tuesday, January 1, 2019 | 2336319000 | 2648848000 |
| Wednesday, January 1, 2020 | 2682891000 | 2388855000 |
| Friday, January 1, 2021 | 2988244000 | 2833736000 |
| Saturday, January 1, 2022 | 3561718000 | 3427129000 |
| Sunday, January 1, 2023 | 4089986000 | 3757719000 |
| Monday, January 1, 2024 | 4641264000 | 3974589000 |
Unleashing insights
In the ever-evolving landscape of technology and financial services, understanding revenue trends is crucial. Over the past decade, Cadence Design Systems, Inc. and Corpay, Inc. have shown remarkable growth. From 2014 to 2023, Cadence's revenue surged by approximately 159%, while Corpay's revenue increased by about 213%. This growth highlights the dynamic nature of these industries, with Cadence leading in electronic design automation and Corpay excelling in payment solutions.
These trends underscore the resilience and adaptability of both companies in their respective fields, making them key players to watch in the coming years.
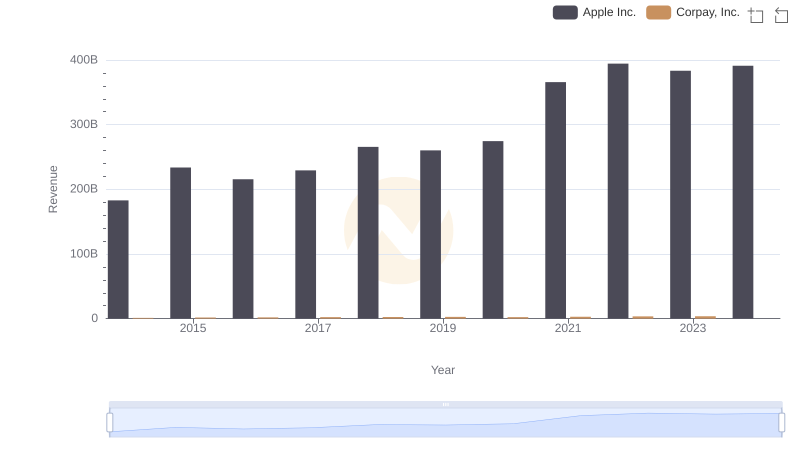
Apple Inc. vs Corpay, Inc.: Annual Revenue Growth Compared
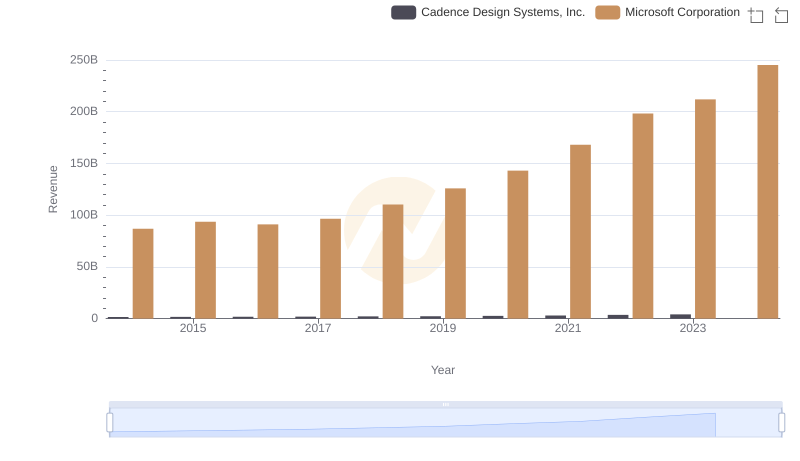
Annual Revenue Comparison: Microsoft Corporation vs Cadence Design Systems, Inc.
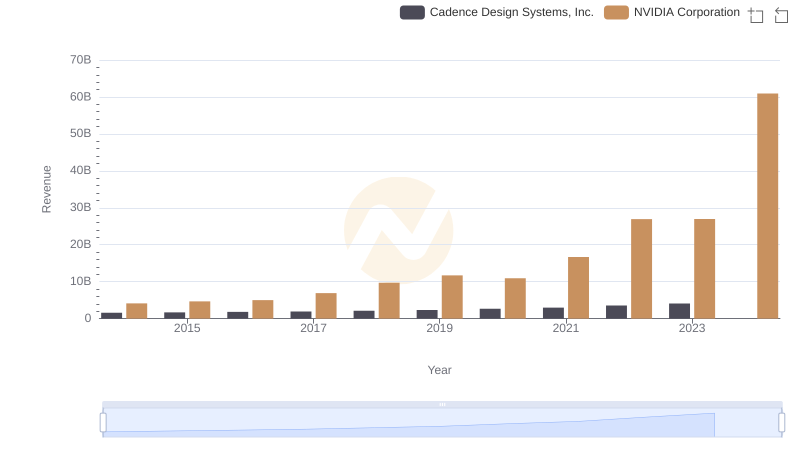
Annual Revenue Comparison: NVIDIA Corporation vs Cadence Design Systems, Inc.
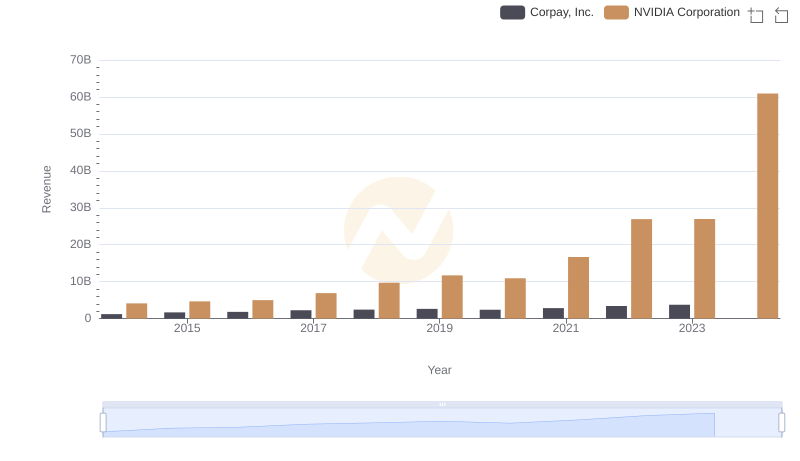
Comparing Revenue Performance: NVIDIA Corporation or Corpay, Inc.?
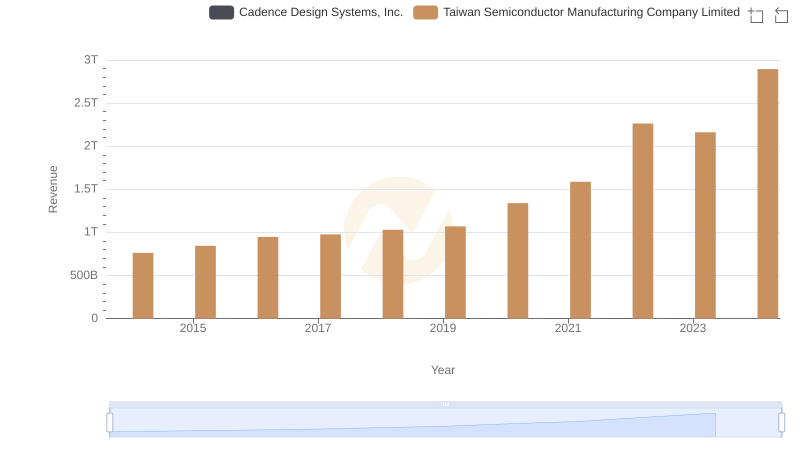
Comparing Revenue Performance: Taiwan Semiconductor Manufacturing Company Limited or Cadence Design Systems, Inc.?
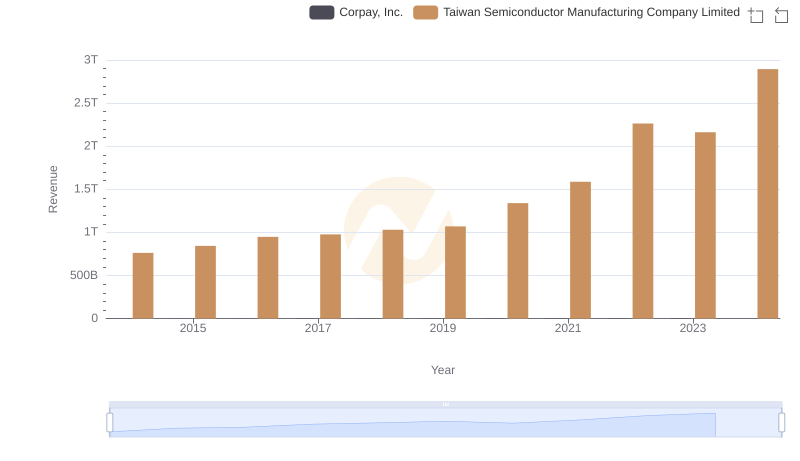
Comparing Revenue Performance: Taiwan Semiconductor Manufacturing Company Limited or Corpay, Inc.?
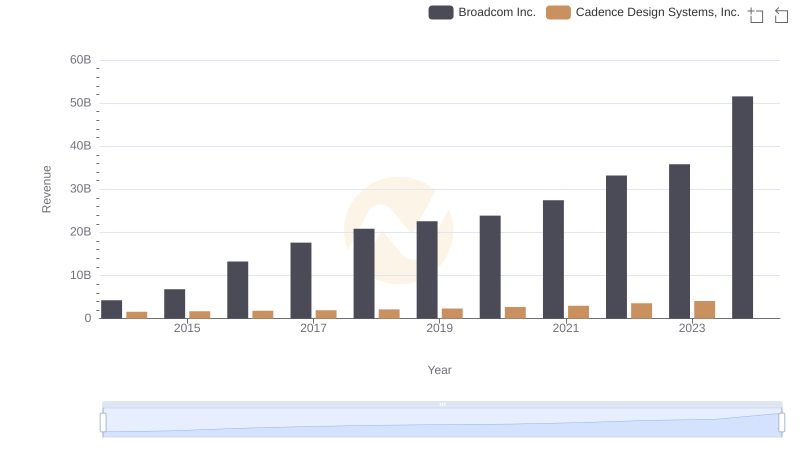
Broadcom Inc. and Cadence Design Systems, Inc.: A Comprehensive Revenue Analysis
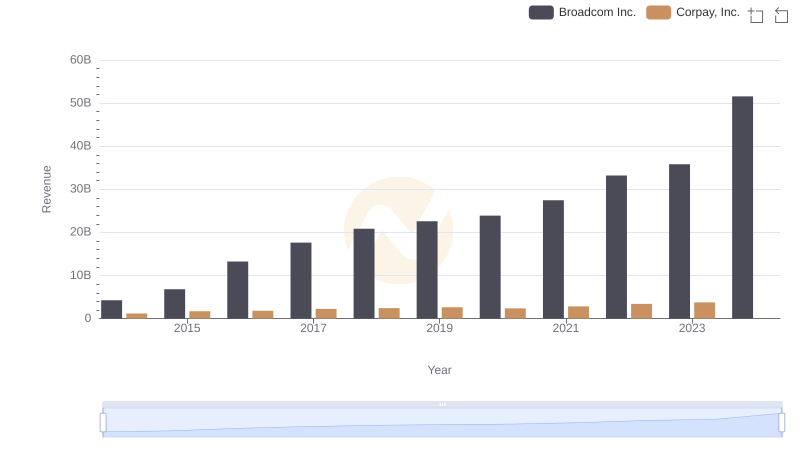
Broadcom Inc. and Corpay, Inc.: A Comprehensive Revenue Analysis
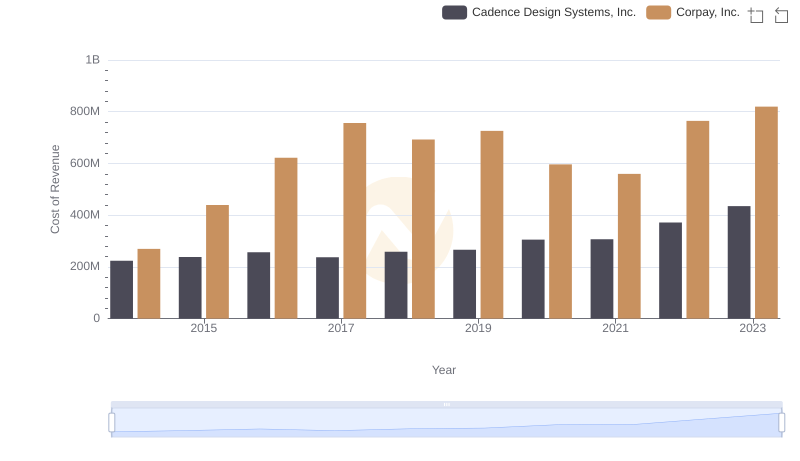
Comparing Cost of Revenue Efficiency: Cadence Design Systems, Inc. vs Corpay, Inc.
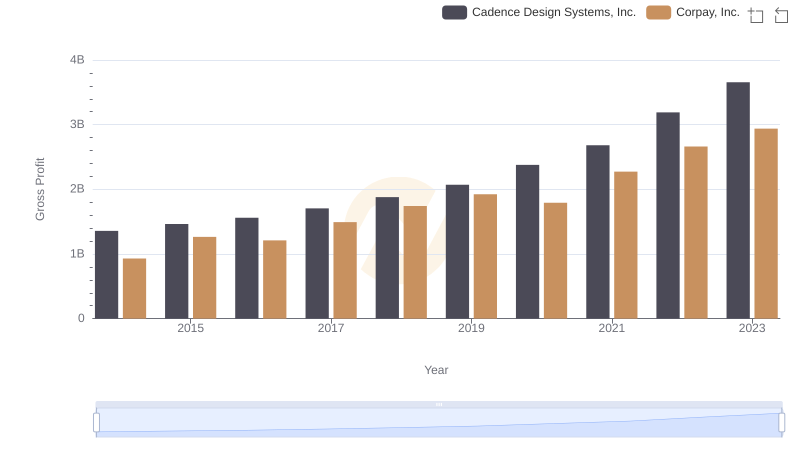
Gross Profit Comparison: Cadence Design Systems, Inc. and Corpay, Inc. Trends
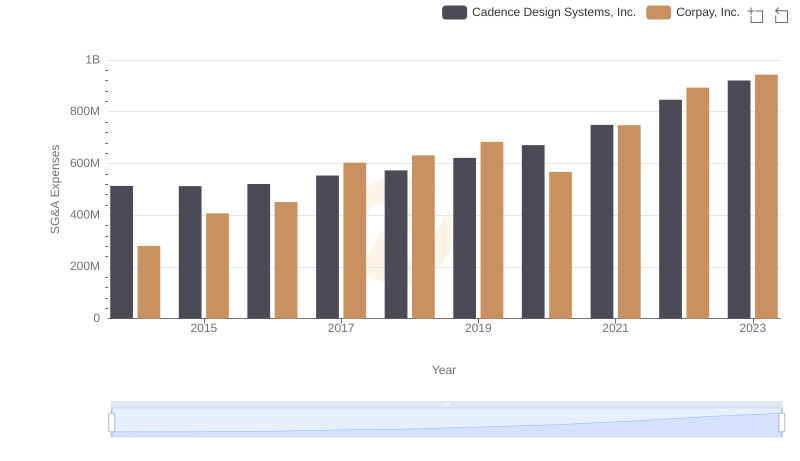
Cadence Design Systems, Inc. or Corpay, Inc.: Who Manages SG&A Costs Better?
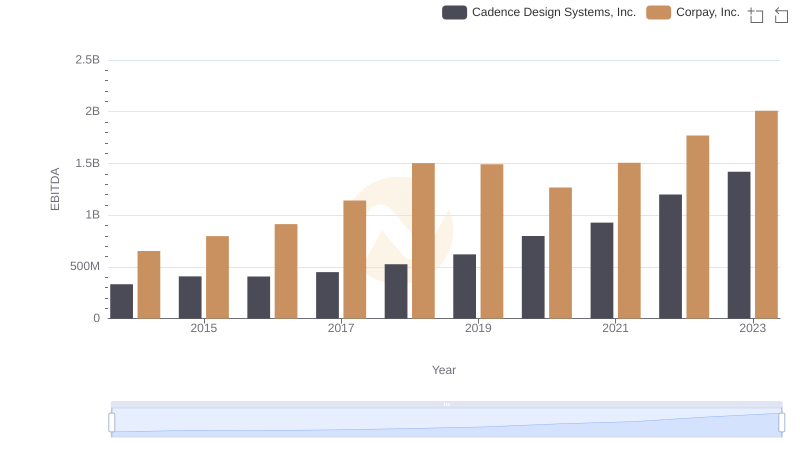
Cadence Design Systems, Inc. and Corpay, Inc.: A Detailed Examination of EBITDA Performance