| __timestamp | Cadence Design Systems, Inc. | Corpay, Inc. |
|---|---|---|
| Wednesday, January 1, 2014 | 332530000 | 654160000 |
| Thursday, January 1, 2015 | 408806000 | 797545000 |
| Friday, January 1, 2016 | 406544000 | 912906000 |
| Sunday, January 1, 2017 | 448885000 | 1142269000 |
| Monday, January 1, 2018 | 526019000 | 1502885000 |
| Tuesday, January 1, 2019 | 620586000 | 1491751000 |
| Wednesday, January 1, 2020 | 799150000 | 1267130000 |
| Friday, January 1, 2021 | 927723000 | 1506710000 |
| Saturday, January 1, 2022 | 1200385000 | 1770532000 |
| Sunday, January 1, 2023 | 1419630000 | 2008995000 |
| Monday, January 1, 2024 | 1350763000 | 2119258000 |
Cracking the code
In the ever-evolving landscape of technology and financial services, understanding the financial health of industry leaders is crucial. This analysis delves into the EBITDA performance of Cadence Design Systems, Inc. and Corpay, Inc. over the past decade, from 2014 to 2023.
Cadence Design Systems, Inc. has shown a remarkable growth trajectory, with its EBITDA increasing by over 300% during this period. Starting at approximately $332 million in 2014, it reached a peak of nearly $1.42 billion in 2023. This growth underscores Cadence's strategic advancements in electronic design automation.
Meanwhile, Corpay, Inc. has also demonstrated significant growth, with its EBITDA rising by over 200%, from around $654 million in 2014 to $2 billion in 2023. This reflects Corpay's robust expansion in the financial technology sector.
Both companies have consistently outperformed industry averages, showcasing their resilience and adaptability in a competitive market.
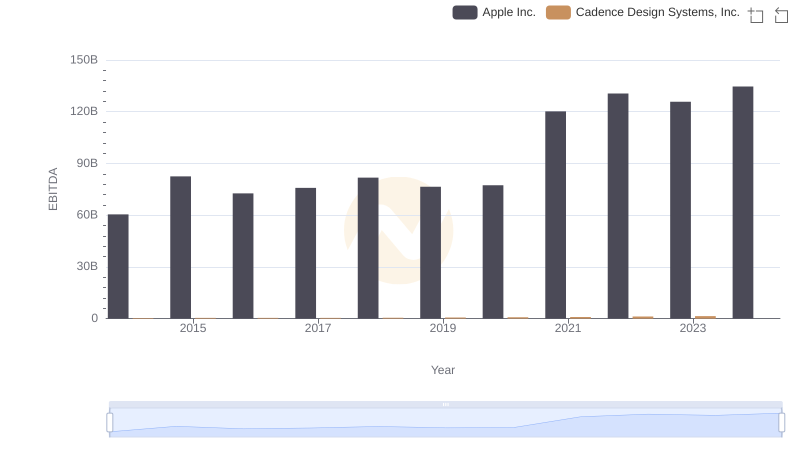
Professional EBITDA Benchmarking: Apple Inc. vs Cadence Design Systems, Inc.
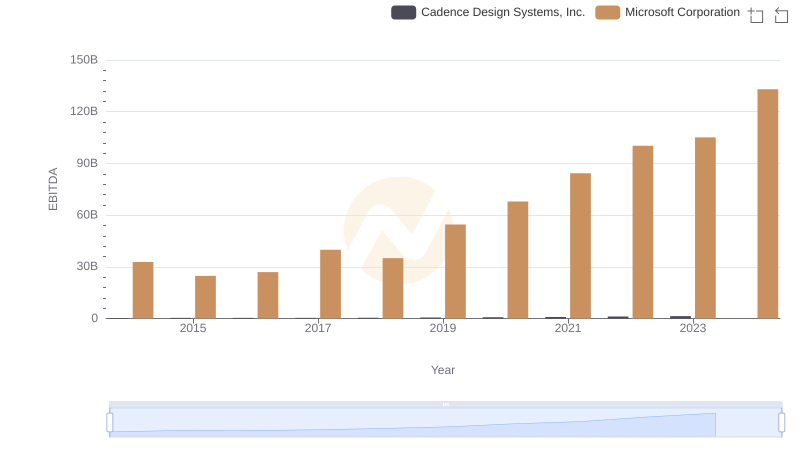
EBITDA Analysis: Evaluating Microsoft Corporation Against Cadence Design Systems, Inc.
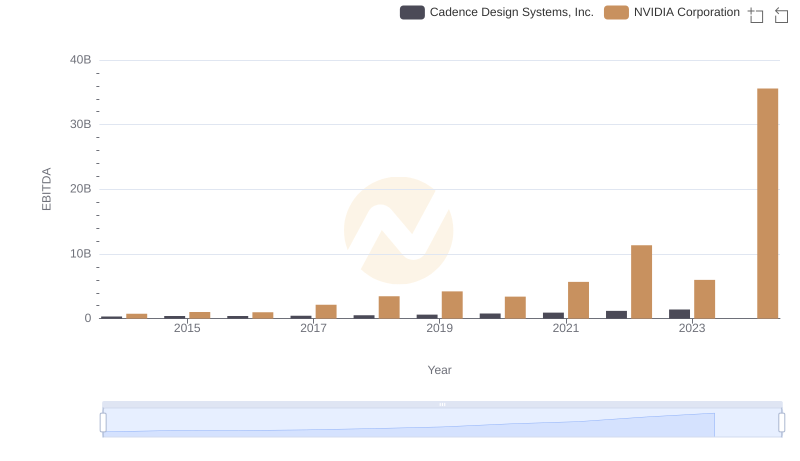
EBITDA Analysis: Evaluating NVIDIA Corporation Against Cadence Design Systems, Inc.
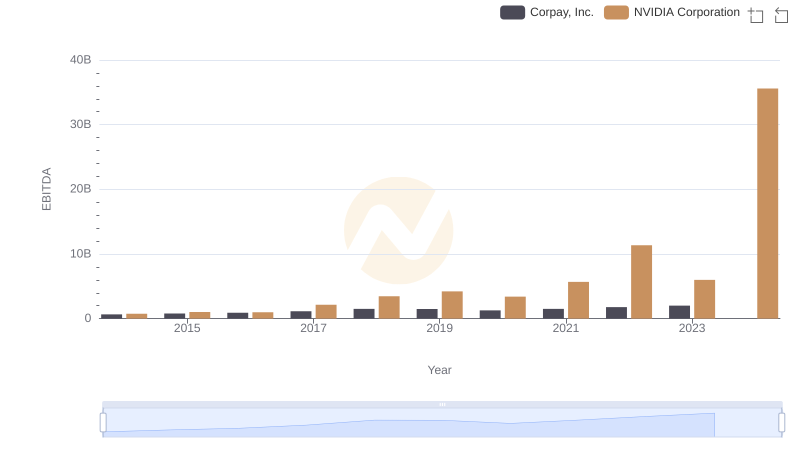
A Professional Review of EBITDA: NVIDIA Corporation Compared to Corpay, Inc.
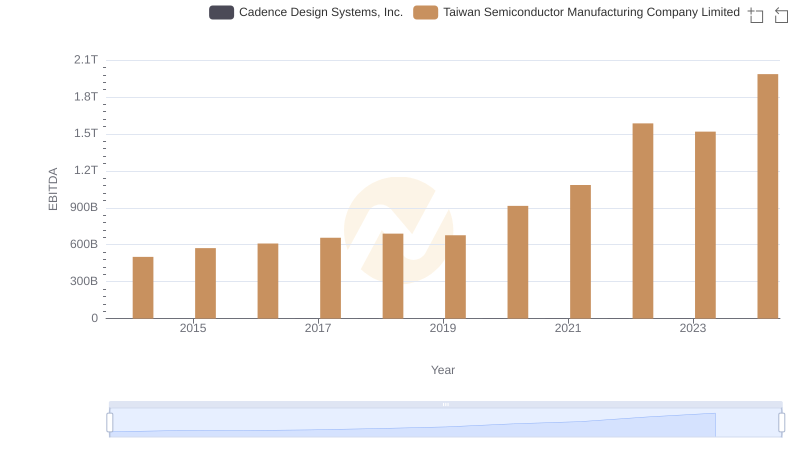
EBITDA Metrics Evaluated: Taiwan Semiconductor Manufacturing Company Limited vs Cadence Design Systems, Inc.
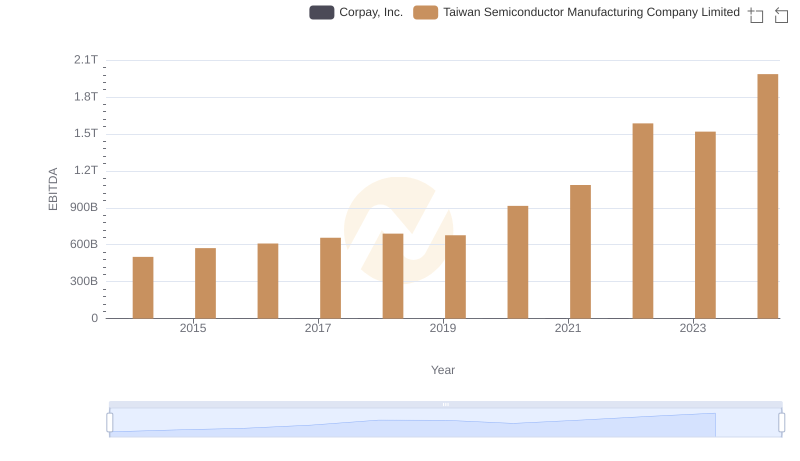
A Professional Review of EBITDA: Taiwan Semiconductor Manufacturing Company Limited Compared to Corpay, Inc.
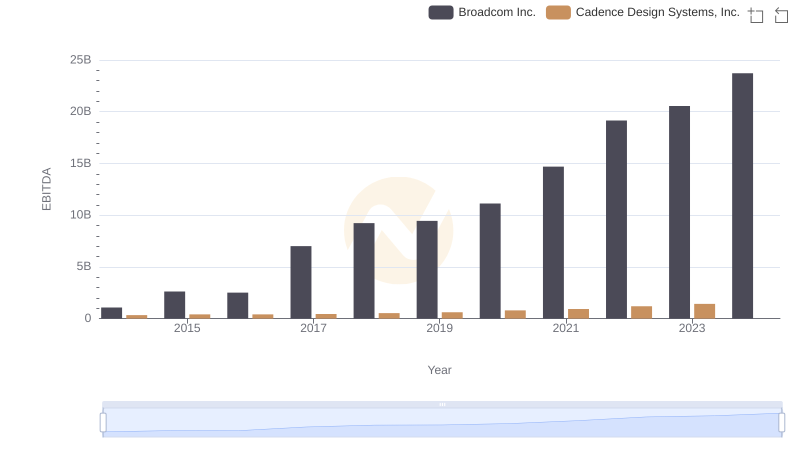
EBITDA Analysis: Evaluating Broadcom Inc. Against Cadence Design Systems, Inc.
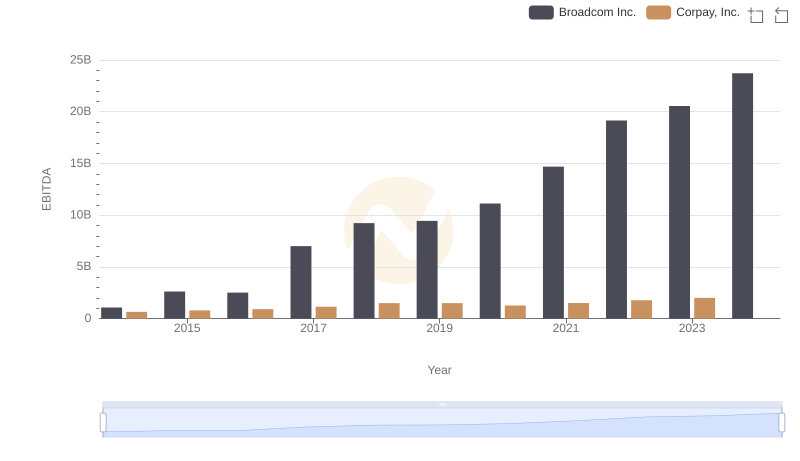
Professional EBITDA Benchmarking: Broadcom Inc. vs Corpay, Inc.
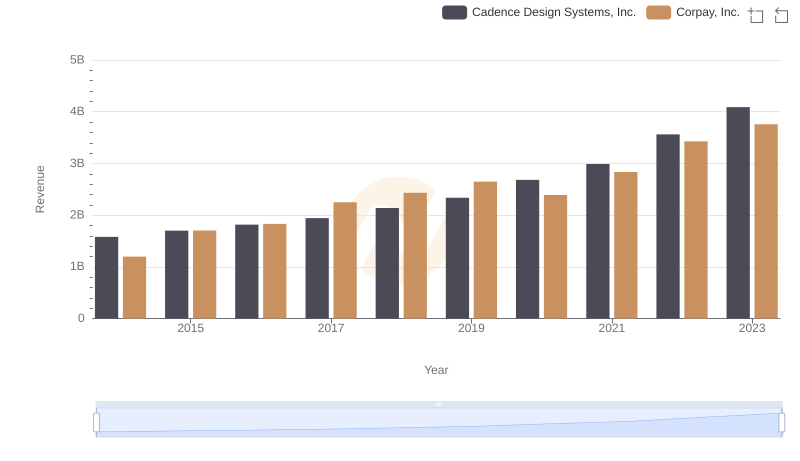
Breaking Down Revenue Trends: Cadence Design Systems, Inc. vs Corpay, Inc.
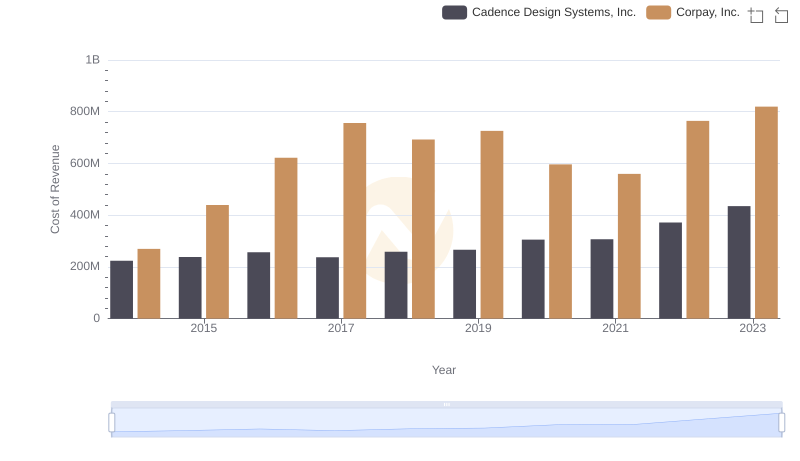
Comparing Cost of Revenue Efficiency: Cadence Design Systems, Inc. vs Corpay, Inc.
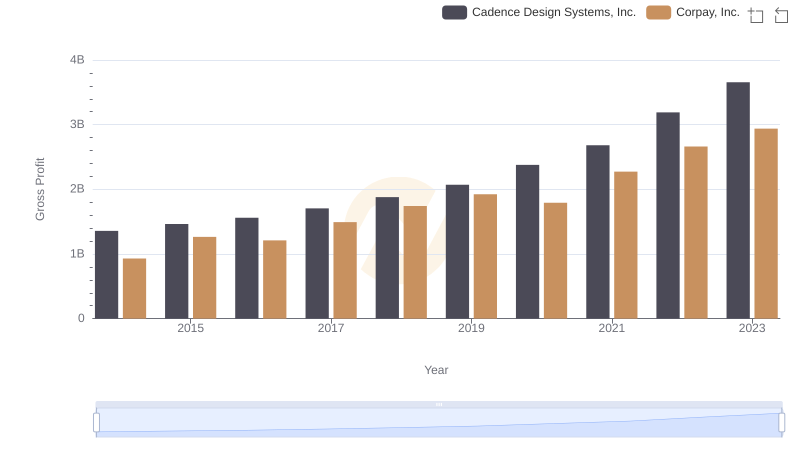
Gross Profit Comparison: Cadence Design Systems, Inc. and Corpay, Inc. Trends
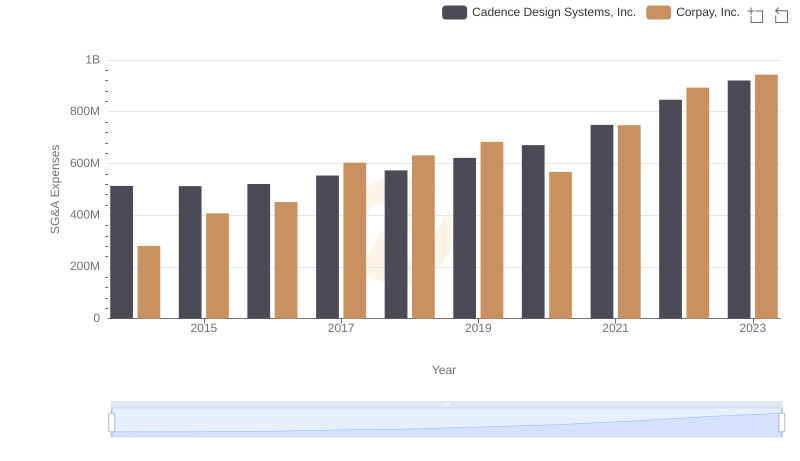
Cadence Design Systems, Inc. or Corpay, Inc.: Who Manages SG&A Costs Better?