| __timestamp | Cadence Design Systems, Inc. | Corpay, Inc. |
|---|---|---|
| Wednesday, January 1, 2014 | 223706000 | 269591000 |
| Thursday, January 1, 2015 | 238453000 | 439330000 |
| Friday, January 1, 2016 | 256492000 | 621965000 |
| Sunday, January 1, 2017 | 237390000 | 756337000 |
| Monday, January 1, 2018 | 258747000 | 692584000 |
| Tuesday, January 1, 2019 | 266357000 | 726044000 |
| Wednesday, January 1, 2020 | 305498000 | 596363000 |
| Friday, January 1, 2021 | 307006000 | 559819000 |
| Saturday, January 1, 2022 | 371623000 | 764707000 |
| Sunday, January 1, 2023 | 435041000 | 819908000 |
| Monday, January 1, 2024 | 210902000 | 0 |
Unveiling the hidden dimensions of data
In the ever-evolving landscape of technology and finance, understanding cost efficiency is crucial. Over the past decade, Cadence Design Systems, Inc. and Corpay, Inc. have showcased distinct trajectories in their cost of revenue. From 2014 to 2023, Cadence Design Systems saw a steady increase, with costs rising by approximately 94%, reflecting their strategic investments in innovation. Meanwhile, Corpay, Inc. experienced a more dramatic surge of around 204%, indicating aggressive expansion and market penetration.
This comparison not only highlights the companies' differing strategies but also offers insights into their market positioning and operational efficiencies.
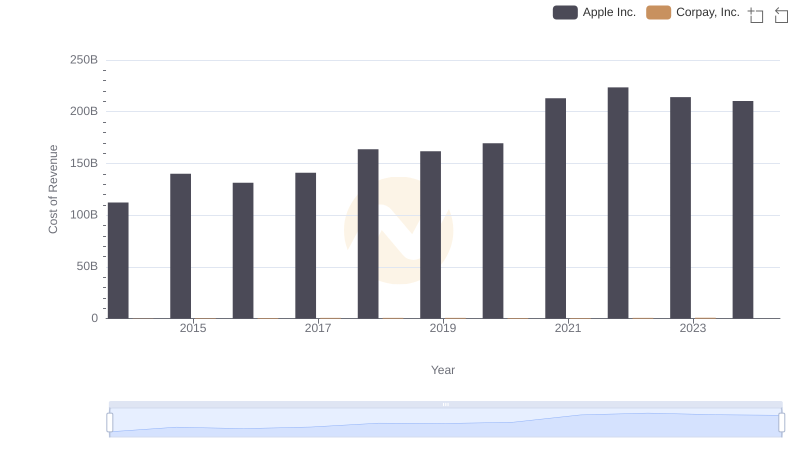
Comparing Cost of Revenue Efficiency: Apple Inc. vs Corpay, Inc.
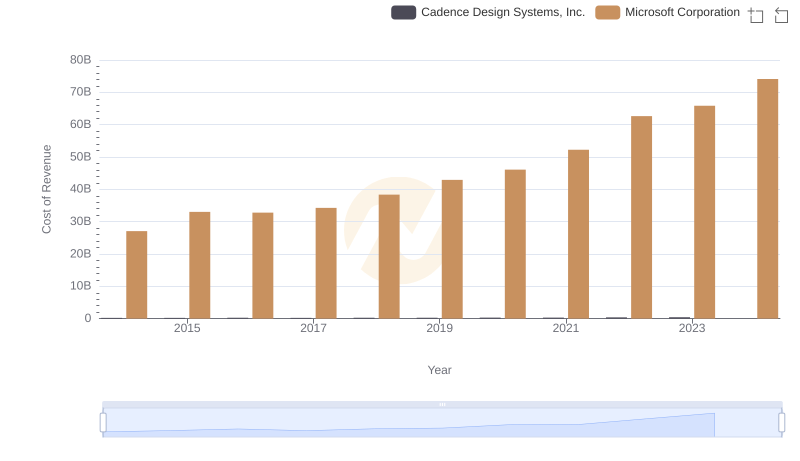
Cost of Revenue Comparison: Microsoft Corporation vs Cadence Design Systems, Inc.
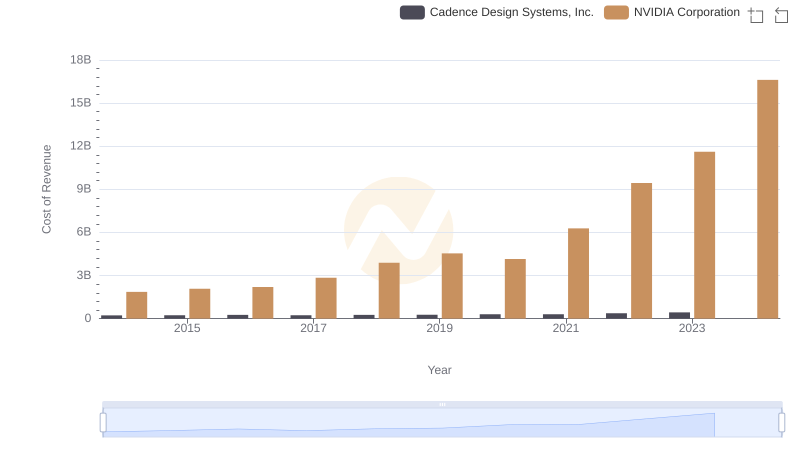
Cost of Revenue Trends: NVIDIA Corporation vs Cadence Design Systems, Inc.
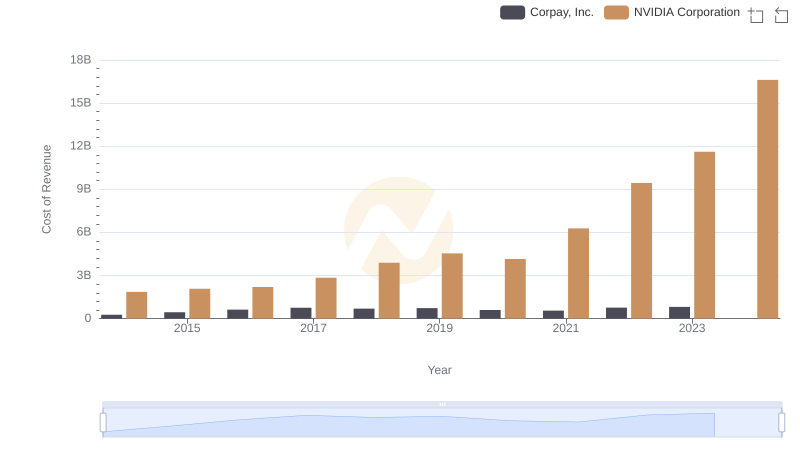
Analyzing Cost of Revenue: NVIDIA Corporation and Corpay, Inc.
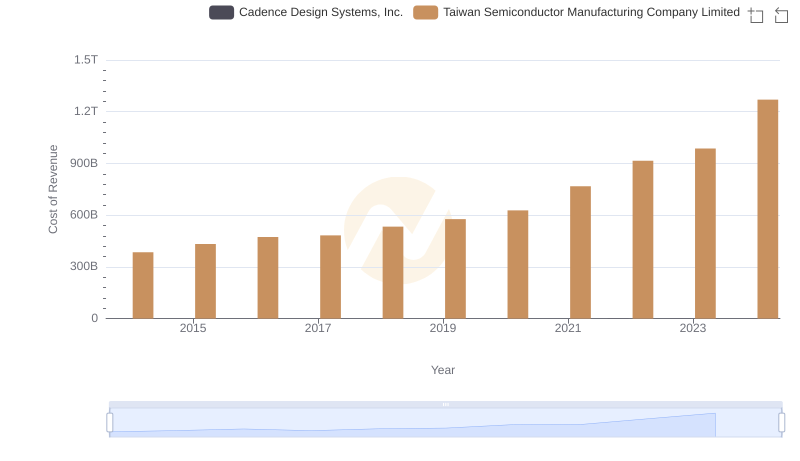
Analyzing Cost of Revenue: Taiwan Semiconductor Manufacturing Company Limited and Cadence Design Systems, Inc.
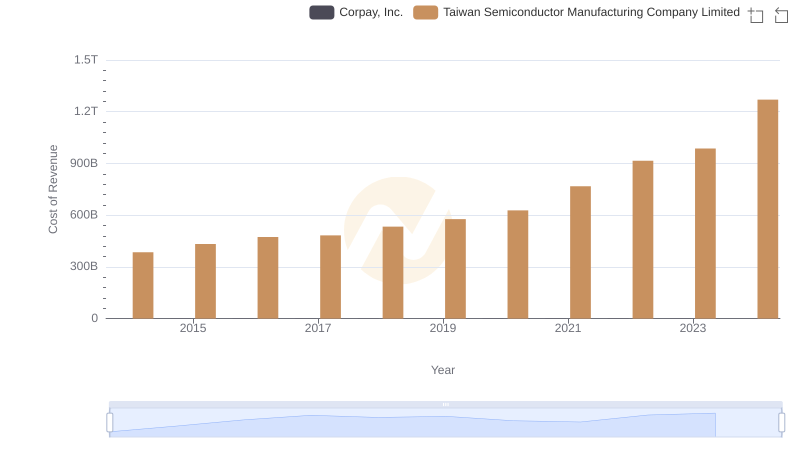
Analyzing Cost of Revenue: Taiwan Semiconductor Manufacturing Company Limited and Corpay, Inc.
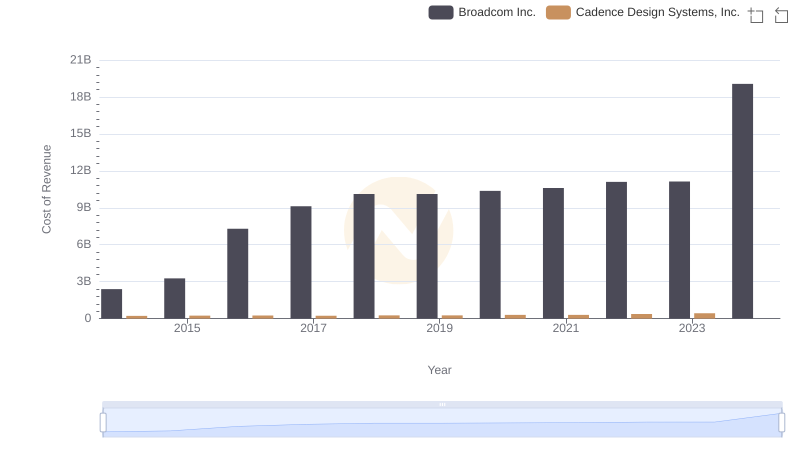
Cost of Revenue: Key Insights for Broadcom Inc. and Cadence Design Systems, Inc.
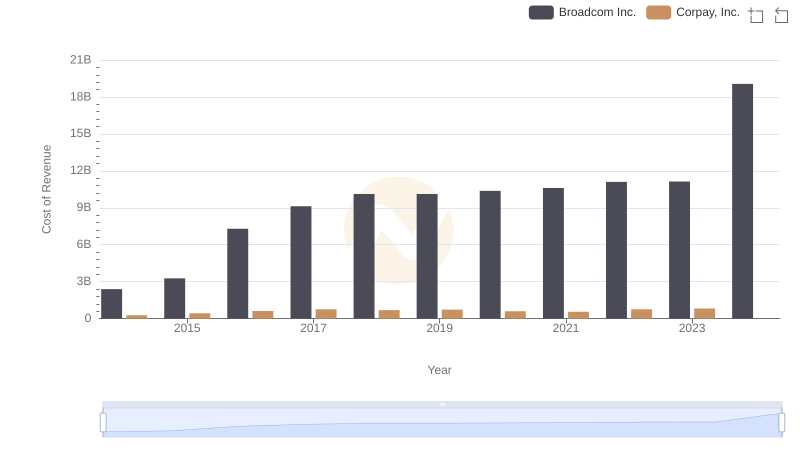
Cost Insights: Breaking Down Broadcom Inc. and Corpay, Inc.'s Expenses
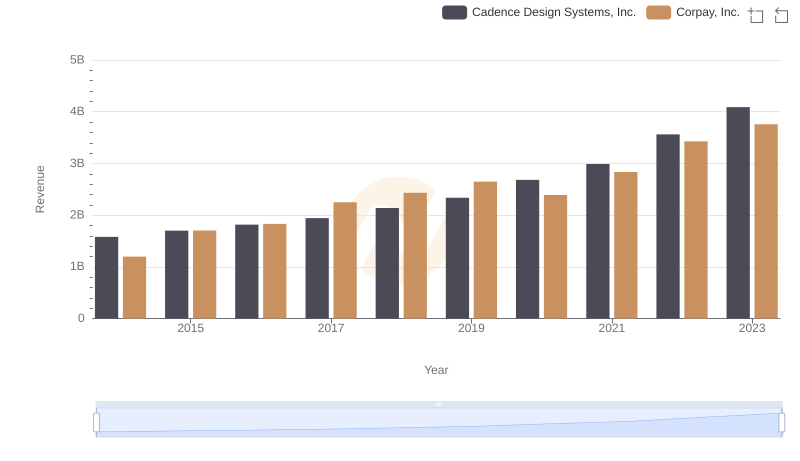
Breaking Down Revenue Trends: Cadence Design Systems, Inc. vs Corpay, Inc.
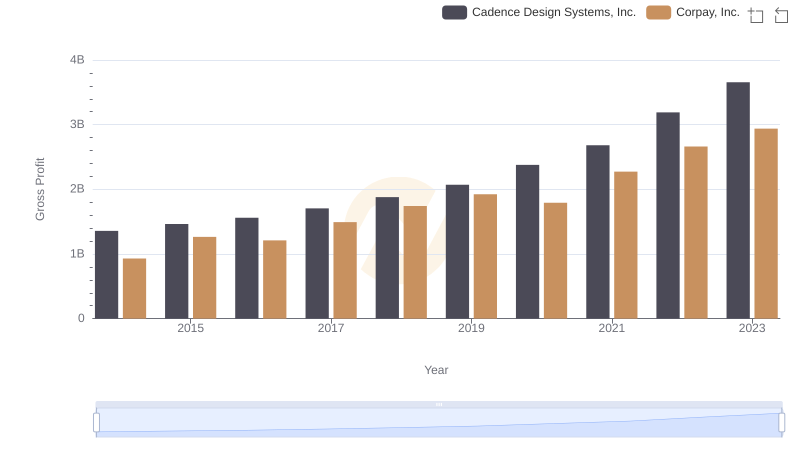
Gross Profit Comparison: Cadence Design Systems, Inc. and Corpay, Inc. Trends
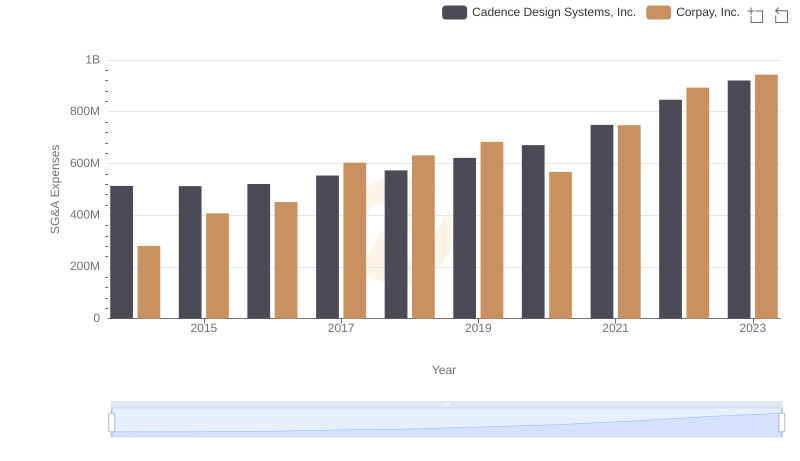
Cadence Design Systems, Inc. or Corpay, Inc.: Who Manages SG&A Costs Better?
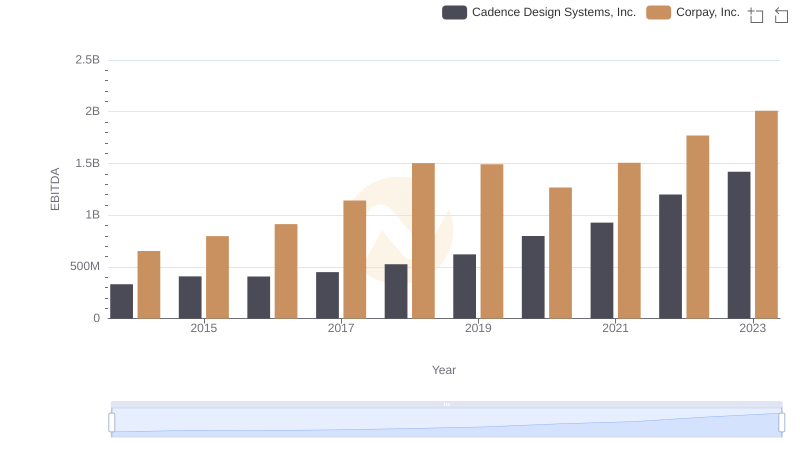
Cadence Design Systems, Inc. and Corpay, Inc.: A Detailed Examination of EBITDA Performance