| __timestamp | Ingersoll Rand Inc. | Parker-Hannifin Corporation |
|---|---|---|
| Wednesday, January 1, 2014 | 26000000 | 410132000 |
| Thursday, January 1, 2015 | 26000000 | 403085000 |
| Friday, January 1, 2016 | 22000000 | 359796000 |
| Sunday, January 1, 2017 | 26000000 | 336675000 |
| Monday, January 1, 2018 | 24000000 | 327877000 |
| Tuesday, January 1, 2019 | 25000000 | 294852000 |
| Wednesday, January 1, 2020 | 58000000 | 293837000 |
| Friday, January 1, 2021 | 74000000 | 259039000 |
| Saturday, January 1, 2022 | 91000000 | 191000000 |
| Sunday, January 1, 2023 | 108000000 | 258000000 |
| Monday, January 1, 2024 | 0 | 298000000 |
Infusing magic into the data realm
In the ever-evolving landscape of industrial innovation, research and development (R&D) play a pivotal role. Over the past decade, Parker-Hannifin Corporation and Ingersoll Rand Inc. have demonstrated contrasting R&D investment strategies. Parker-Hannifin consistently allocated substantial resources, peaking in 2014 with over 400 million in R&D expenses. However, by 2023, this figure had decreased by approximately 37% to 258 million, reflecting a strategic shift or market adaptation.
Conversely, Ingersoll Rand's R&D spending surged by over 300% from 2014 to 2023, reaching 108 million. This aggressive increase underscores a commitment to innovation and competitiveness. Notably, 2024 data for Ingersoll Rand is missing, leaving room for speculation on future trends. As these industrial titans navigate the challenges of a dynamic market, their R&D investments will continue to shape their trajectories and influence the broader industry landscape.
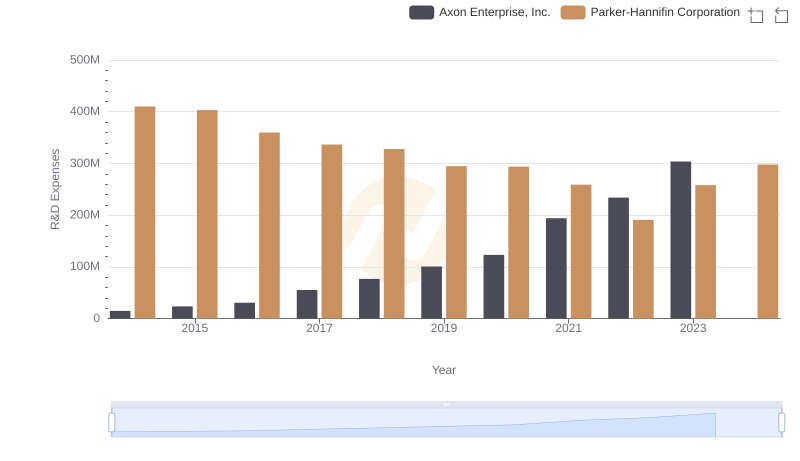
R&D Spending Showdown: Parker-Hannifin Corporation vs Axon Enterprise, Inc.
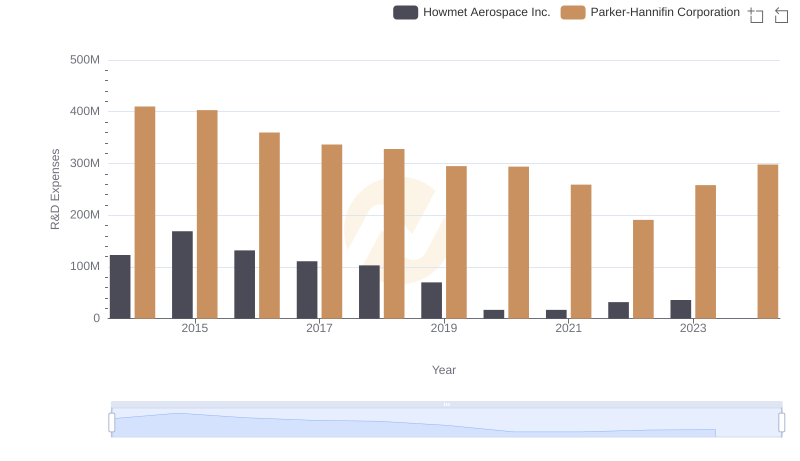
Analyzing R&D Budgets: Parker-Hannifin Corporation vs Howmet Aerospace Inc.
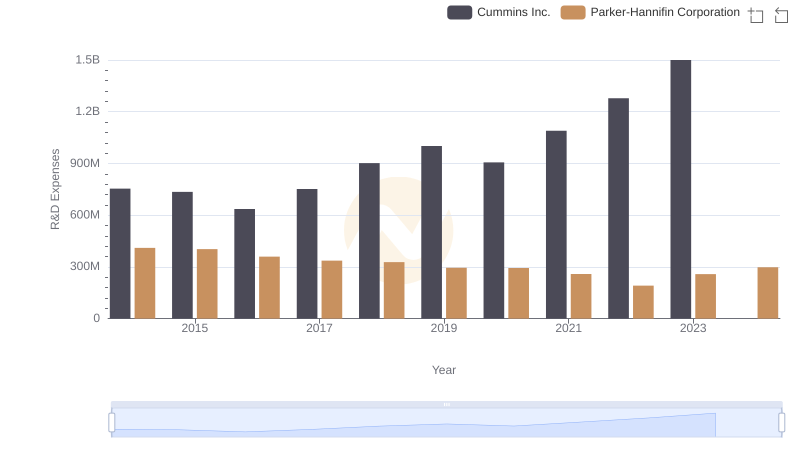
Parker-Hannifin Corporation vs Cummins Inc.: Strategic Focus on R&D Spending
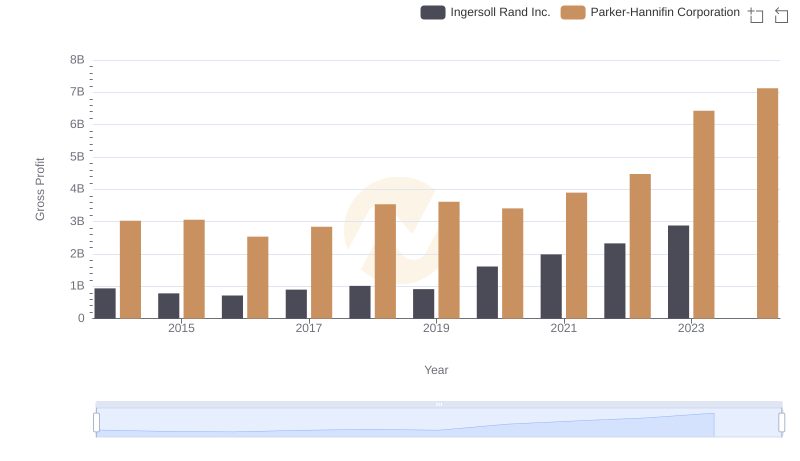
Gross Profit Analysis: Comparing Parker-Hannifin Corporation and Ingersoll Rand Inc.
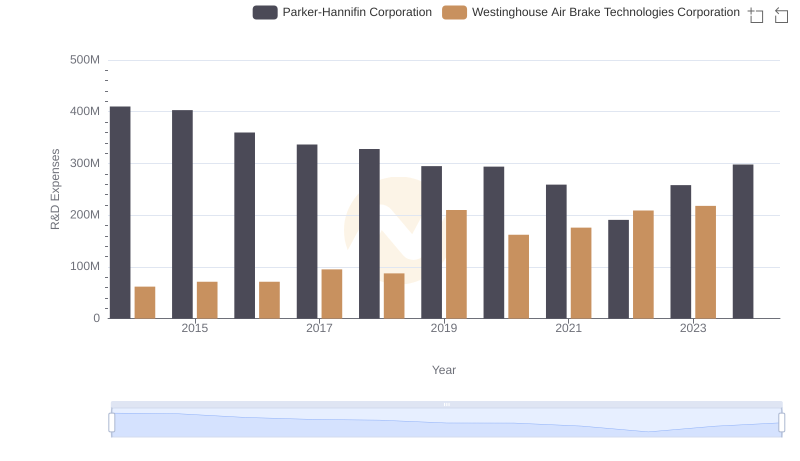
Parker-Hannifin Corporation vs Westinghouse Air Brake Technologies Corporation: Strategic Focus on R&D Spending

Parker-Hannifin Corporation vs Rockwell Automation, Inc.: Strategic Focus on R&D Spending
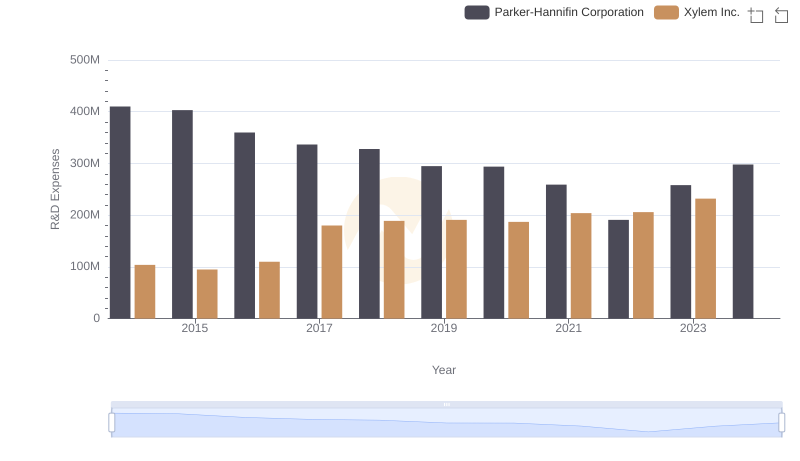
Research and Development Expenses Breakdown: Parker-Hannifin Corporation vs Xylem Inc.
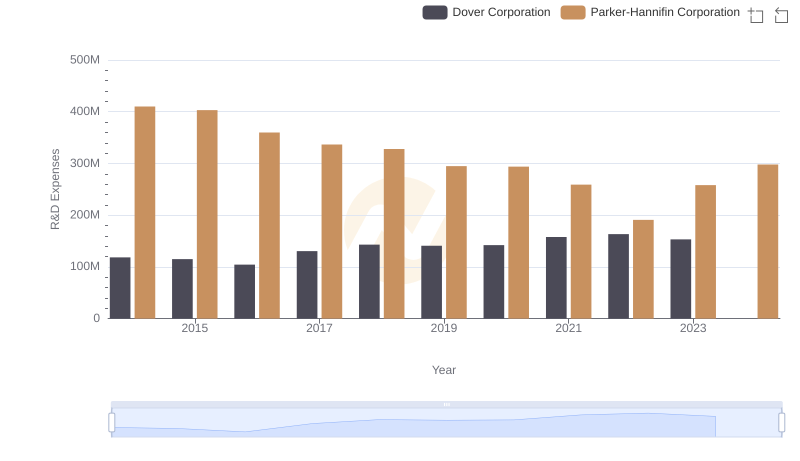
Research and Development: Comparing Key Metrics for Parker-Hannifin Corporation and Dover Corporation