| __timestamp | Eaton Corporation plc | TFI International Inc. |
|---|---|---|
| Wednesday, January 1, 2014 | 6906000000 | 417323364 |
| Thursday, January 1, 2015 | 6563000000 | 352552803 |
| Friday, January 1, 2016 | 6347000000 | 358230042 |
| Sunday, January 1, 2017 | 6648000000 | 405214314 |
| Monday, January 1, 2018 | 7098000000 | 510006388 |
| Tuesday, January 1, 2019 | 7052000000 | 502631921 |
| Wednesday, January 1, 2020 | 5450000000 | 541885000 |
| Friday, January 1, 2021 | 6335000000 | 1037863000 |
| Saturday, January 1, 2022 | 6887000000 | 1426851000 |
| Sunday, January 1, 2023 | 8433000000 | 1265392000 |
| Monday, January 1, 2024 | 9503000000 |
Unleashing insights
In the ever-evolving landscape of industrial and logistics sectors, Eaton Corporation plc and TFI International Inc. have demonstrated intriguing financial trajectories over the past decade. From 2014 to 2023, Eaton's gross profit has shown a steady upward trend, peaking in 2023 with an impressive 22% increase from its 2014 figures. This growth underscores Eaton's robust market strategies and operational efficiencies.
Conversely, TFI International Inc. has experienced a remarkable transformation, with its gross profit surging by over 200% during the same period. This dramatic rise highlights TFI's strategic expansions and acquisitions, positioning it as a formidable player in the logistics industry.
These insights not only reflect the companies' financial health but also provide a window into the broader economic shifts influencing the industrial and logistics sectors. As we move forward, these trends will be pivotal in shaping future market dynamics.
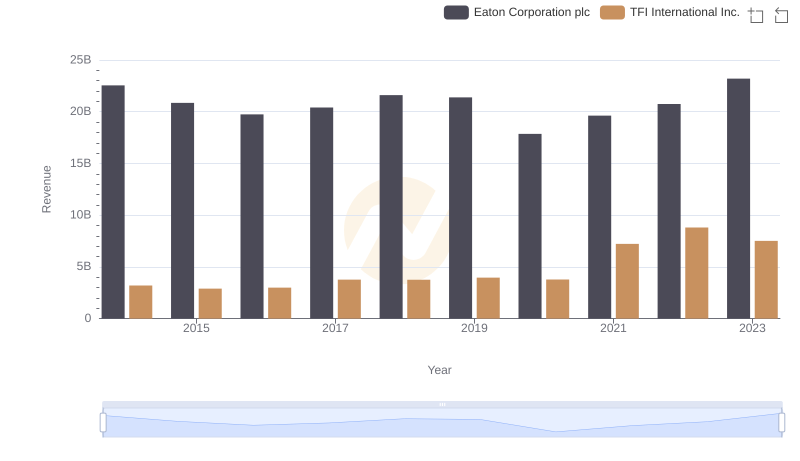
Eaton Corporation plc or TFI International Inc.: Who Leads in Yearly Revenue?
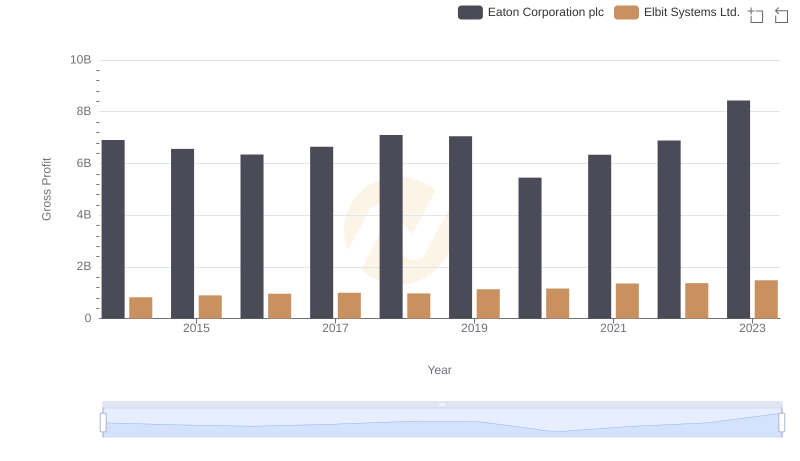
Key Insights on Gross Profit: Eaton Corporation plc vs Elbit Systems Ltd.
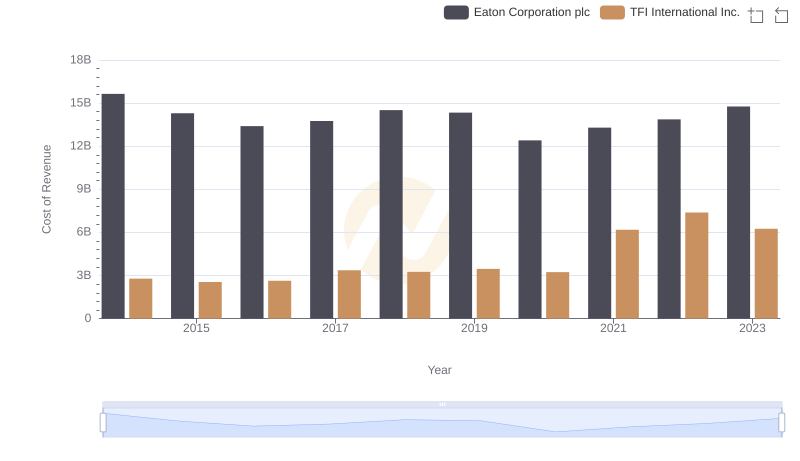
Cost of Revenue Trends: Eaton Corporation plc vs TFI International Inc.
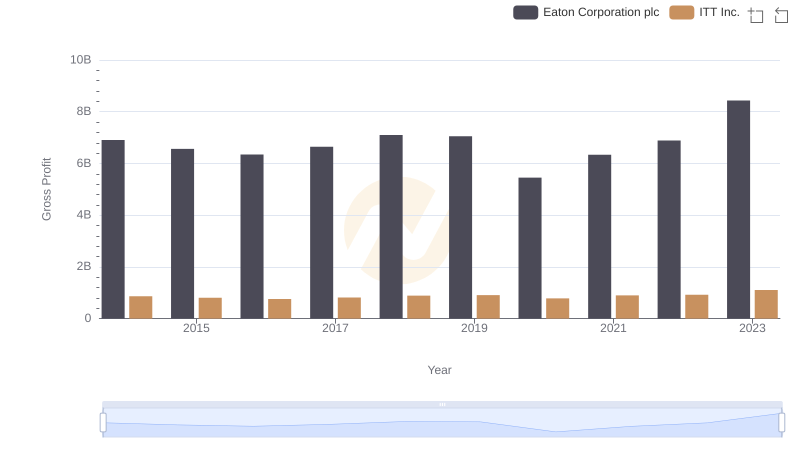
Gross Profit Analysis: Comparing Eaton Corporation plc and ITT Inc.
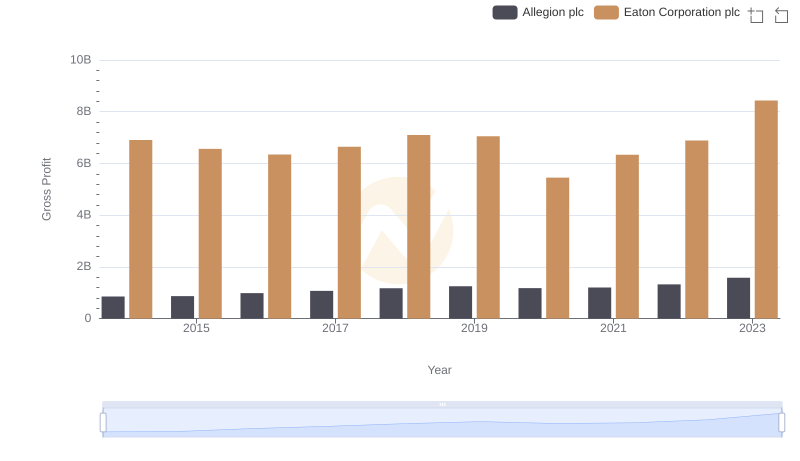
Key Insights on Gross Profit: Eaton Corporation plc vs Allegion plc