| __timestamp | Eaton Corporation plc | Roper Technologies, Inc. |
|---|---|---|
| Wednesday, January 1, 2014 | 3810000000 | 1102426000 |
| Thursday, January 1, 2015 | 3596000000 | 1136728000 |
| Friday, January 1, 2016 | 3505000000 | 1277847000 |
| Sunday, January 1, 2017 | 3565000000 | 1654552000 |
| Monday, January 1, 2018 | 3548000000 | 1883100000 |
| Tuesday, January 1, 2019 | 3583000000 | 1928700000 |
| Wednesday, January 1, 2020 | 3075000000 | 2111900000 |
| Friday, January 1, 2021 | 3256000000 | 2337700000 |
| Saturday, January 1, 2022 | 3227000000 | 2228300000 |
| Sunday, January 1, 2023 | 3795000000 | 1915900000 |
| Monday, January 1, 2024 | 4077000000 | 2881500000 |
Cracking the code
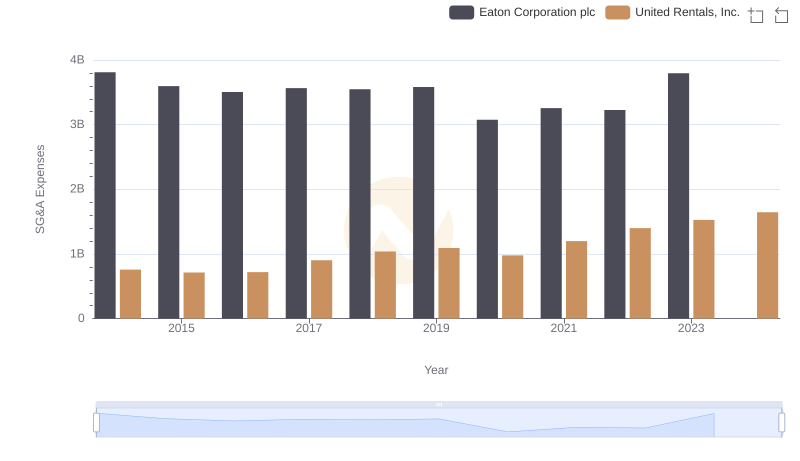
In the ever-evolving landscape of industrial and technological innovation, understanding the financial strategies of leading corporations is crucial. This analysis delves into the Selling, General, and Administrative (SG&A) expenses of Eaton Corporation plc and Roper Technologies, Inc. from 2014 to 2023.
Eaton Corporation, a powerhouse in power management, consistently allocated a significant portion of its budget to SG&A expenses, peaking in 2014 and 2023. Despite a dip in 2020, Eaton's expenses rebounded, reflecting a strategic focus on operational efficiency and market expansion.
Conversely, Roper Technologies, a leader in software and engineered products, exhibited a steady increase in SG&A expenses, with a notable rise of over 110% from 2014 to 2021. This trend underscores Roper's commitment to innovation and customer engagement.
These insights reveal the distinct financial strategies of two industry giants, offering a window into their operational priorities and market positioning.
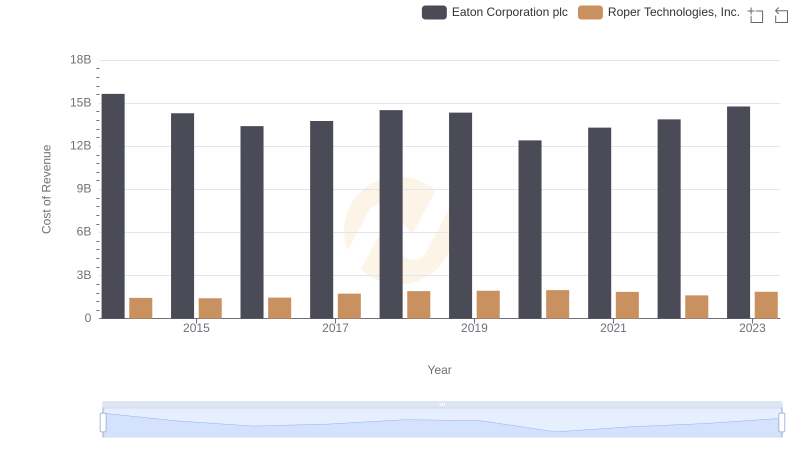
Comparing Cost of Revenue Efficiency: Eaton Corporation plc vs Roper Technologies, Inc.
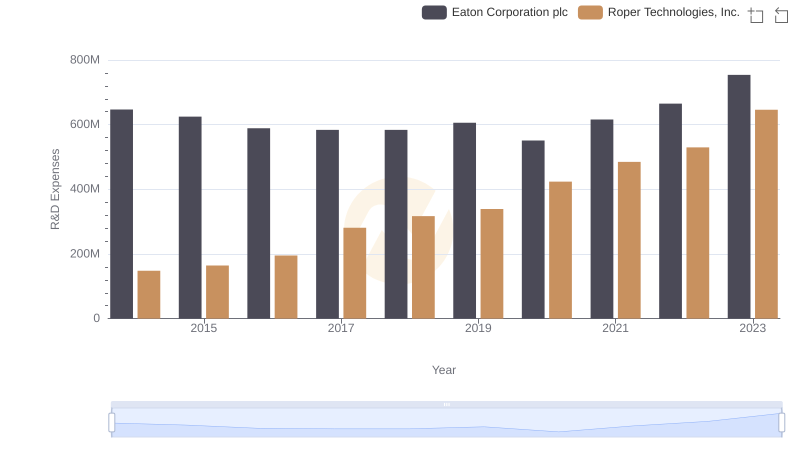
Comparing Innovation Spending: Eaton Corporation plc and Roper Technologies, Inc.
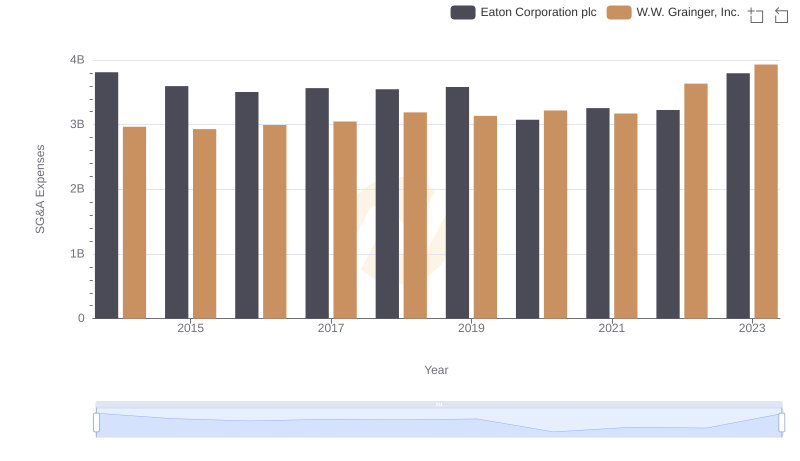
Selling, General, and Administrative Costs: Eaton Corporation plc vs W.W. Grainger, Inc.
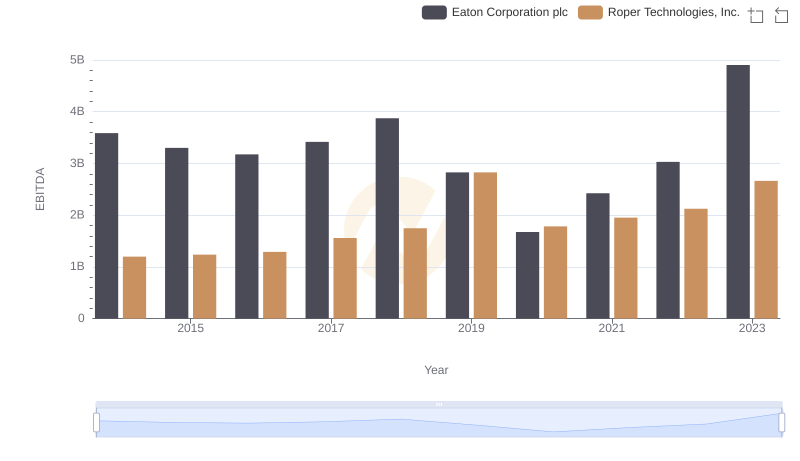
A Professional Review of EBITDA: Eaton Corporation plc Compared to Roper Technologies, Inc.
Eaton Corporation plc and United Rentals, Inc.: SG&A Spending Patterns Compared