| __timestamp | Eaton Corporation plc | United Rentals, Inc. |
|---|---|---|
| Wednesday, January 1, 2014 | 3810000000 | 758000000 |
| Thursday, January 1, 2015 | 3596000000 | 714000000 |
| Friday, January 1, 2016 | 3505000000 | 719000000 |
| Sunday, January 1, 2017 | 3565000000 | 903000000 |
| Monday, January 1, 2018 | 3548000000 | 1038000000 |
| Tuesday, January 1, 2019 | 3583000000 | 1092000000 |
| Wednesday, January 1, 2020 | 3075000000 | 979000000 |
| Friday, January 1, 2021 | 3256000000 | 1199000000 |
| Saturday, January 1, 2022 | 3227000000 | 1400000000 |
| Sunday, January 1, 2023 | 3795000000 | 1527000000 |
| Monday, January 1, 2024 | 4077000000 | 1645000000 |
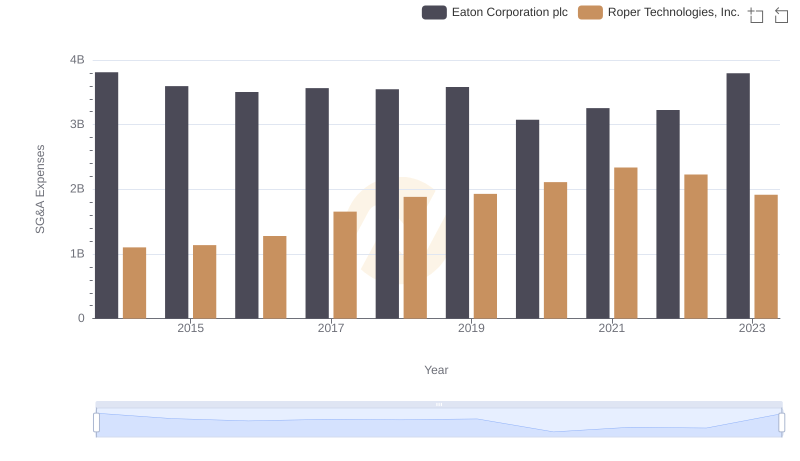
Cracking the code
In the ever-evolving landscape of corporate finance, understanding the spending patterns of industry leaders can offer invaluable insights. Eaton Corporation plc and United Rentals, Inc. have showcased distinct trajectories in their Selling, General, and Administrative (SG&A) expenses over the past decade. From 2014 to 2023, Eaton's SG&A expenses have fluctuated, peaking in 2014 and 2023, with a notable dip in 2020. In contrast, United Rentals has demonstrated a consistent upward trend, with a remarkable 115% increase from 2014 to 2023. This divergence highlights Eaton's strategic cost management amidst market challenges, while United Rentals' growth reflects its aggressive expansion strategy. The data for 2024 is incomplete for Eaton, suggesting a potential shift or reevaluation in their financial strategy. As these companies navigate the complexities of the global market, their SG&A spending patterns offer a window into their operational priorities and future directions.