| __timestamp | Eaton Corporation plc | W.W. Grainger, Inc. |
|---|---|---|
| Wednesday, January 1, 2014 | 3810000000 | 2967125000 |
| Thursday, January 1, 2015 | 3596000000 | 2931108000 |
| Friday, January 1, 2016 | 3505000000 | 2995060000 |
| Sunday, January 1, 2017 | 3565000000 | 3048895000 |
| Monday, January 1, 2018 | 3548000000 | 3190000000 |
| Tuesday, January 1, 2019 | 3583000000 | 3135000000 |
| Wednesday, January 1, 2020 | 3075000000 | 3219000000 |
| Friday, January 1, 2021 | 3256000000 | 3173000000 |
| Saturday, January 1, 2022 | 3227000000 | 3634000000 |
| Sunday, January 1, 2023 | 3795000000 | 3931000000 |
| Monday, January 1, 2024 | 4077000000 | 4121000000 |
Unleashing the power of data
In the ever-evolving landscape of industrial giants, Eaton Corporation plc and W.W. Grainger, Inc. have showcased intriguing trends in their Selling, General, and Administrative (SG&A) expenses over the past decade. From 2014 to 2023, Eaton's SG&A costs fluctuated, peaking in 2014 and 2023, with a notable dip in 2020. Meanwhile, Grainger's expenses steadily climbed, culminating in a 32% increase by 2023. This divergence highlights Eaton's strategic cost management and Grainger's aggressive expansion. Notably, 2020 marked a pivotal year, with Eaton's expenses dropping by 19%, while Grainger's rose by 8%, reflecting differing responses to global challenges. As these industry leaders navigate economic shifts, their SG&A strategies offer valuable insights into operational resilience and growth trajectories.
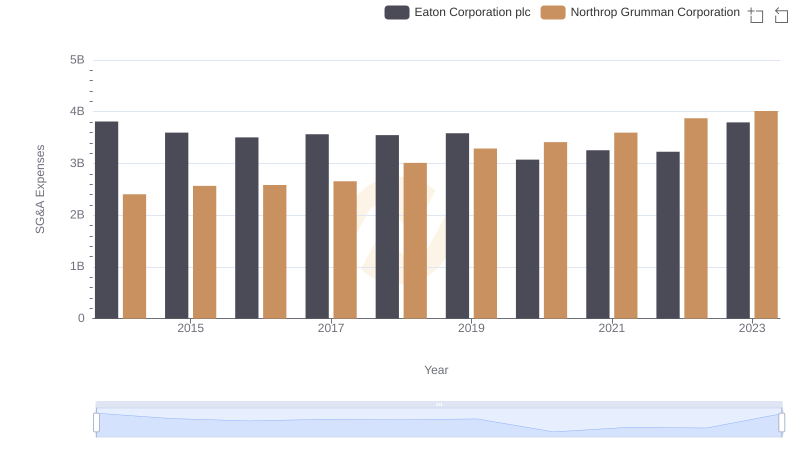
Selling, General, and Administrative Costs: Eaton Corporation plc vs Northrop Grumman Corporation
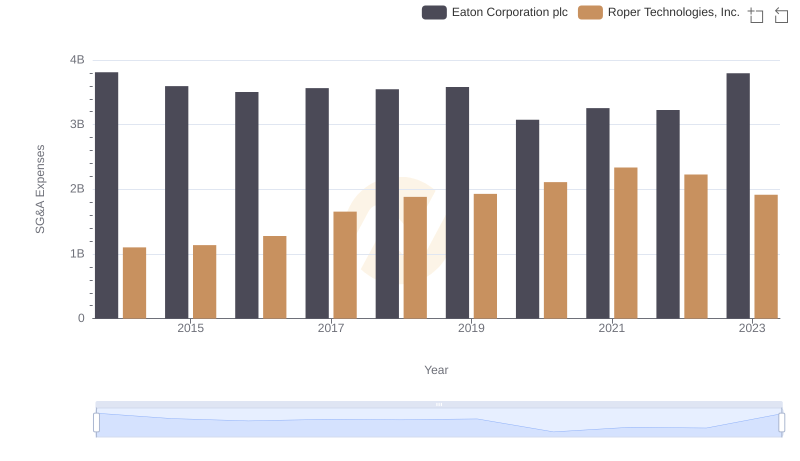
Eaton Corporation plc vs Roper Technologies, Inc.: SG&A Expense Trends
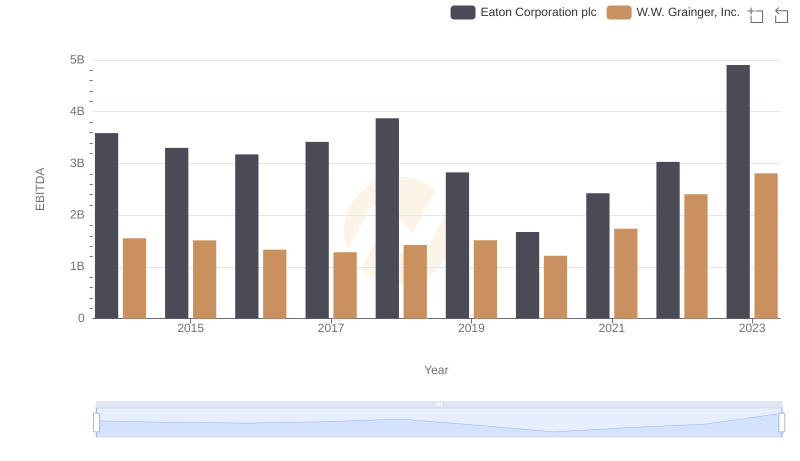
Professional EBITDA Benchmarking: Eaton Corporation plc vs W.W. Grainger, Inc.
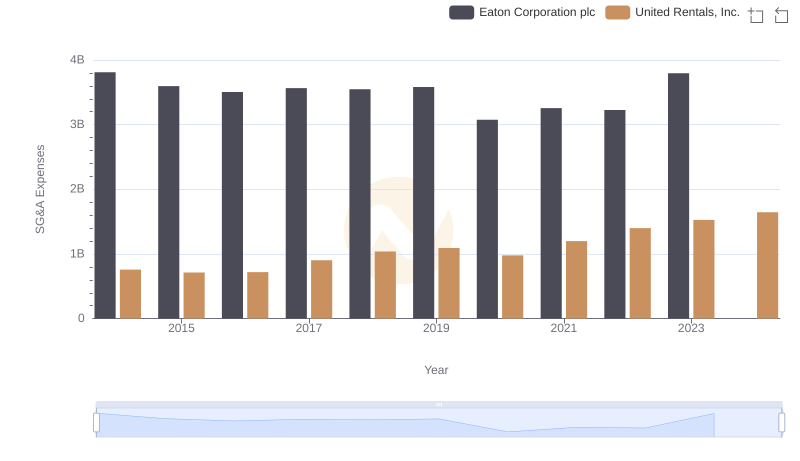
Eaton Corporation plc and United Rentals, Inc.: SG&A Spending Patterns Compared