| __timestamp | Eaton Corporation plc | Roper Technologies, Inc. |
|---|---|---|
| Wednesday, January 1, 2014 | 15646000000 | 1447595000 |
| Thursday, January 1, 2015 | 14292000000 | 1417749000 |
| Friday, January 1, 2016 | 13400000000 | 1457515000 |
| Sunday, January 1, 2017 | 13756000000 | 1742675000 |
| Monday, January 1, 2018 | 14511000000 | 1911700000 |
| Tuesday, January 1, 2019 | 14338000000 | 1939700000 |
| Wednesday, January 1, 2020 | 12408000000 | 1984100000 |
| Friday, January 1, 2021 | 13293000000 | 1860400000 |
| Saturday, January 1, 2022 | 13865000000 | 1619000000 |
| Sunday, January 1, 2023 | 14763000000 | 1870600000 |
| Monday, January 1, 2024 | 15375000000 | 2160900000 |
Igniting the spark of knowledge
In the ever-evolving landscape of industrial technology, cost efficiency remains a pivotal factor for success. Over the past decade, Eaton Corporation plc and Roper Technologies, Inc. have showcased contrasting trajectories in their cost of revenue. Eaton, a leader in power management, has consistently maintained a higher cost of revenue, peaking in 2014 with a 15% higher expenditure compared to its 2023 figures. Meanwhile, Roper Technologies, known for its diversified technology solutions, has demonstrated a more stable cost structure, with a modest 29% increase from 2014 to 2023. This comparison highlights Eaton's strategic shifts towards cost optimization, while Roper's steady approach underscores its resilience in managing operational expenses. As we delve into these insights, it becomes evident that understanding cost dynamics is crucial for stakeholders aiming to navigate the complexities of the industrial sector.
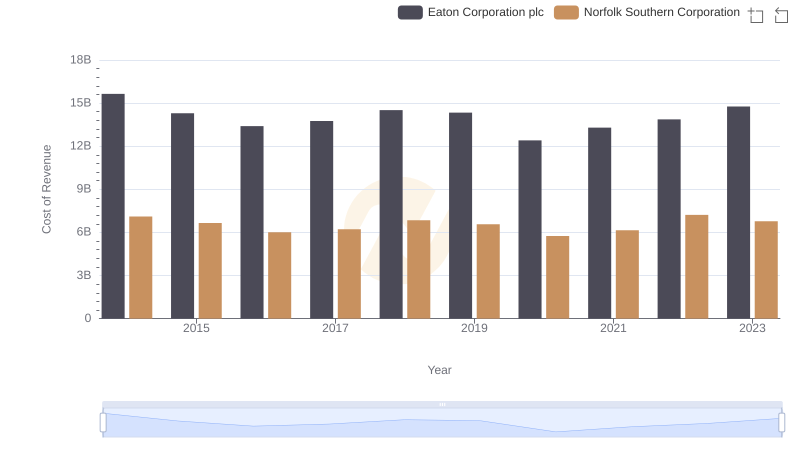
Cost of Revenue Comparison: Eaton Corporation plc vs Norfolk Southern Corporation
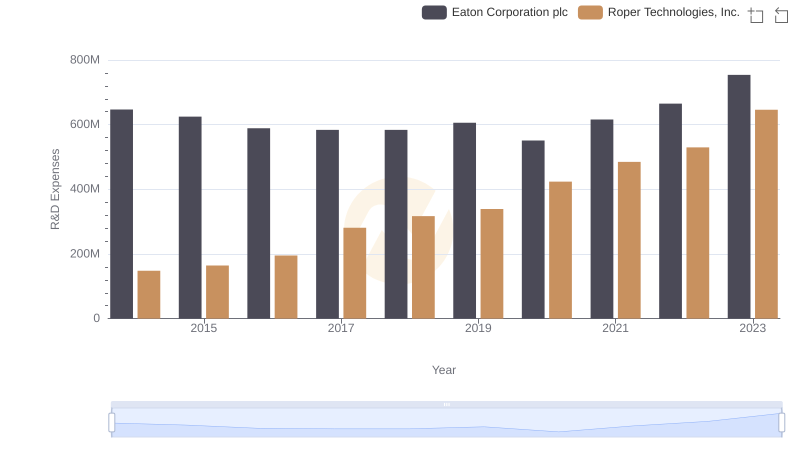
Comparing Innovation Spending: Eaton Corporation plc and Roper Technologies, Inc.
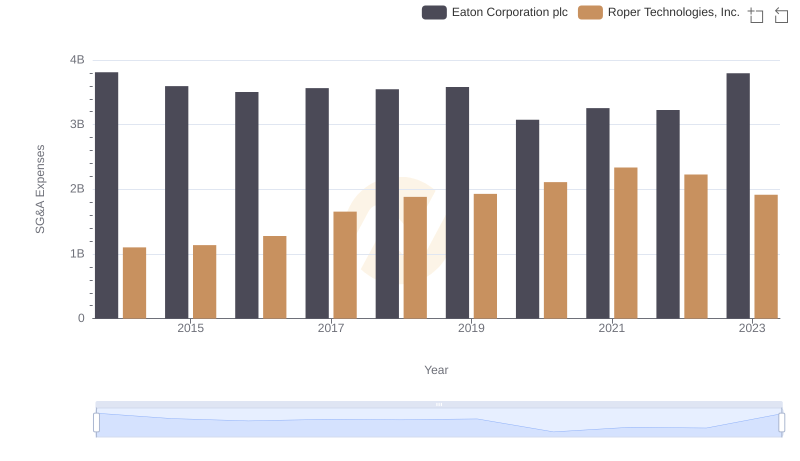
Eaton Corporation plc vs Roper Technologies, Inc.: SG&A Expense Trends
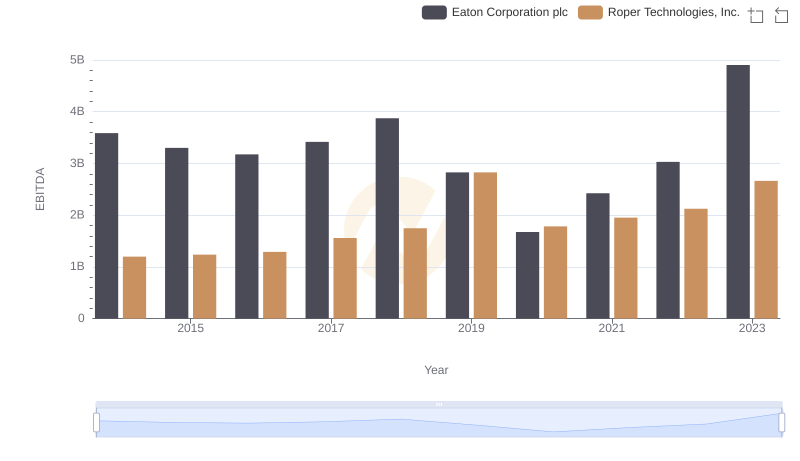
A Professional Review of EBITDA: Eaton Corporation plc Compared to Roper Technologies, Inc.