| __timestamp | C.H. Robinson Worldwide, Inc. | Eaton Corporation plc |
|---|---|---|
| Wednesday, January 1, 2014 | 13470067000 | 22552000000 |
| Thursday, January 1, 2015 | 13476084000 | 20855000000 |
| Friday, January 1, 2016 | 13144413000 | 19747000000 |
| Sunday, January 1, 2017 | 14869380000 | 20404000000 |
| Monday, January 1, 2018 | 16631172000 | 21609000000 |
| Tuesday, January 1, 2019 | 15309508000 | 21390000000 |
| Wednesday, January 1, 2020 | 16207106000 | 17858000000 |
| Friday, January 1, 2021 | 23102138000 | 19628000000 |
| Saturday, January 1, 2022 | 24696625000 | 20752000000 |
| Sunday, January 1, 2023 | 17596443000 | 23196000000 |
| Monday, January 1, 2024 | 17724956000 | 24878000000 |
In pursuit of knowledge
In the ever-evolving landscape of global commerce, understanding revenue trends is crucial for investors and industry analysts alike. This analysis delves into the revenue trajectories of two industrial giants: Eaton Corporation plc and C.H. Robinson Worldwide, Inc., from 2014 to 2023.
Eaton Corporation, a leader in power management, has shown a steady revenue growth over the years. Despite a dip in 2020, likely due to global disruptions, Eaton's revenue rebounded by 30% in 2023 compared to 2020, reaching its peak in the last decade.
C.H. Robinson, a key player in logistics, experienced a significant revenue surge in 2021, with a 43% increase from 2020. However, 2023 saw a 29% decline from its 2022 peak, indicating potential market challenges.
These insights highlight the dynamic nature of these industries and the importance of strategic adaptability.
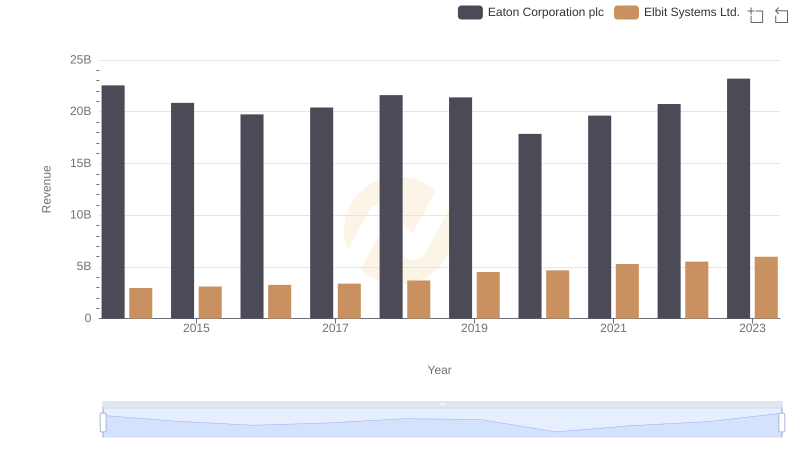
Eaton Corporation plc vs Elbit Systems Ltd.: Examining Key Revenue Metrics
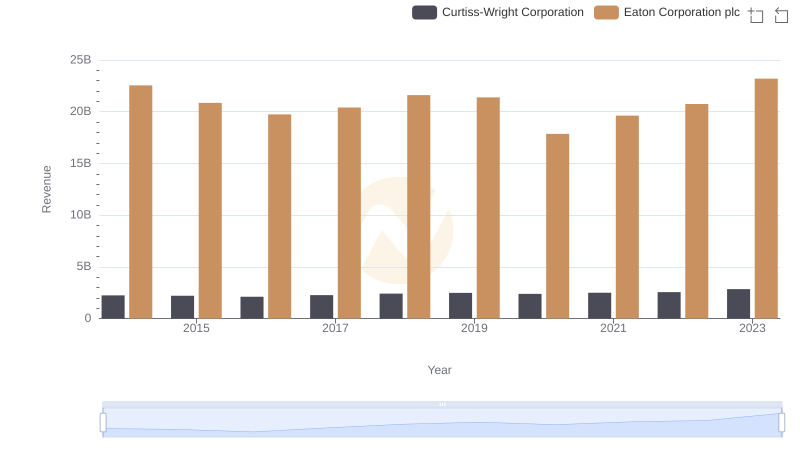
Eaton Corporation plc and Curtiss-Wright Corporation: A Comprehensive Revenue Analysis

Cost of Revenue: Key Insights for Eaton Corporation plc and C.H. Robinson Worldwide, Inc.
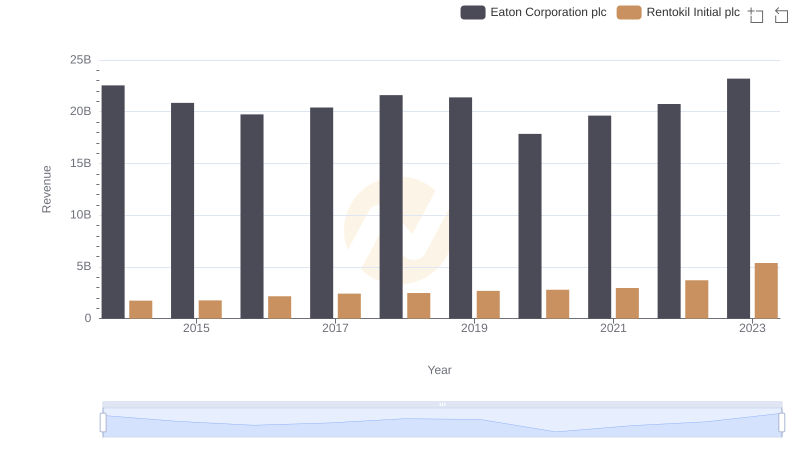
Eaton Corporation plc vs Rentokil Initial plc: Examining Key Revenue Metrics
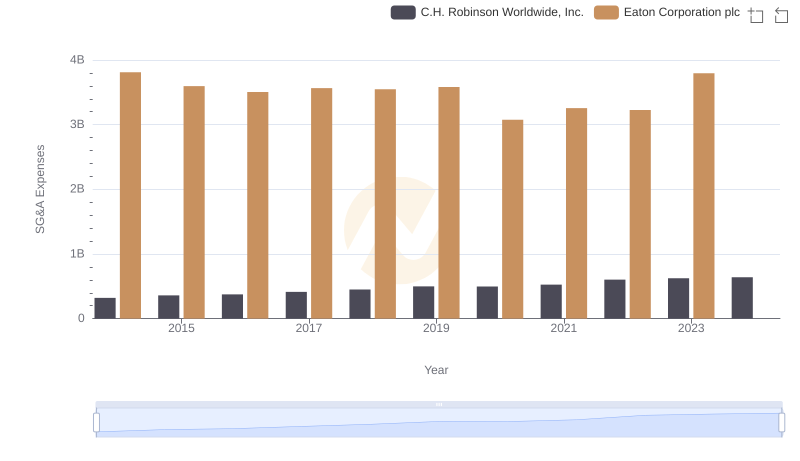
Cost Management Insights: SG&A Expenses for Eaton Corporation plc and C.H. Robinson Worldwide, Inc.
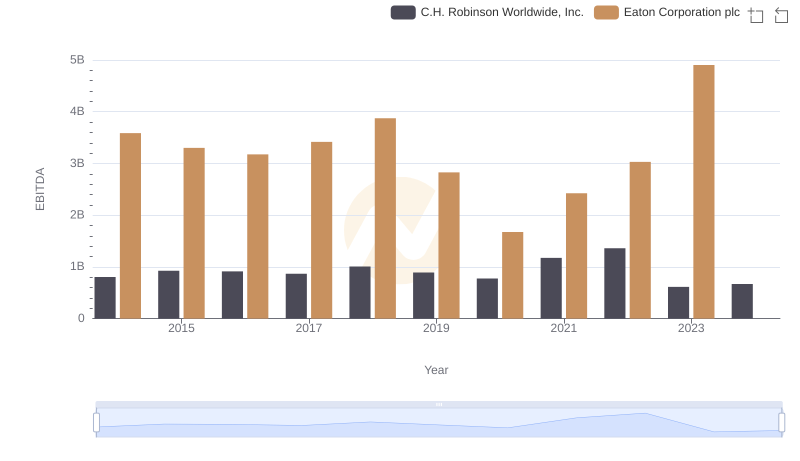
EBITDA Analysis: Evaluating Eaton Corporation plc Against C.H. Robinson Worldwide, Inc.