| __timestamp | Eaton Corporation plc | Owens Corning |
|---|---|---|
| Wednesday, January 1, 2014 | 3810000000 | 487000000 |
| Thursday, January 1, 2015 | 3596000000 | 525000000 |
| Friday, January 1, 2016 | 3505000000 | 584000000 |
| Sunday, January 1, 2017 | 3565000000 | 620000000 |
| Monday, January 1, 2018 | 3548000000 | 700000000 |
| Tuesday, January 1, 2019 | 3583000000 | 698000000 |
| Wednesday, January 1, 2020 | 3075000000 | 664000000 |
| Friday, January 1, 2021 | 3256000000 | 757000000 |
| Saturday, January 1, 2022 | 3227000000 | 803000000 |
| Sunday, January 1, 2023 | 3795000000 | 831000000 |
| Monday, January 1, 2024 | 4077000000 |
Unleashing the power of data
In the ever-evolving landscape of corporate finance, understanding the nuances of Selling, General, and Administrative (SG&A) expenses is crucial. Over the past decade, Eaton Corporation plc and Owens Corning have demonstrated distinct spending patterns. Eaton's SG&A expenses have shown a slight decline, averaging around $3.5 billion annually, with a notable dip in 2020. In contrast, Owens Corning's SG&A expenses have steadily increased by approximately 70% from 2014 to 2023, reaching over $800 million. This divergence highlights Eaton's focus on cost efficiency, while Owens Corning appears to be investing more in administrative and sales functions. Such insights are invaluable for investors and analysts seeking to understand the strategic priorities of these industrial giants. As we move forward, monitoring these trends will provide a window into the companies' operational strategies and market positioning.
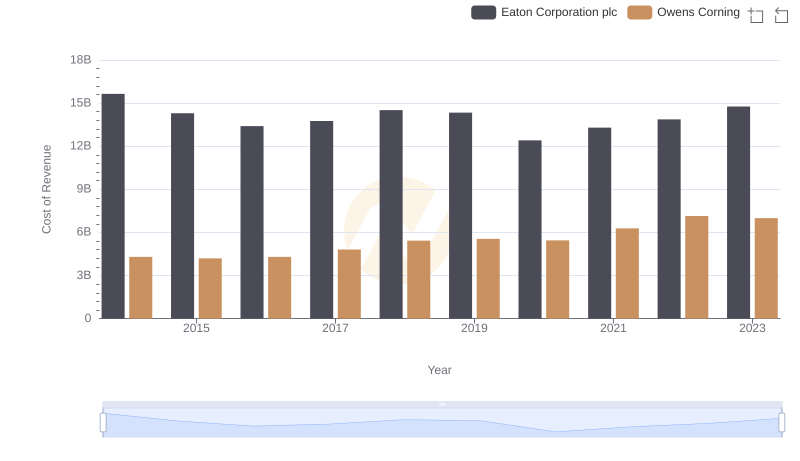
Cost of Revenue Comparison: Eaton Corporation plc vs Owens Corning
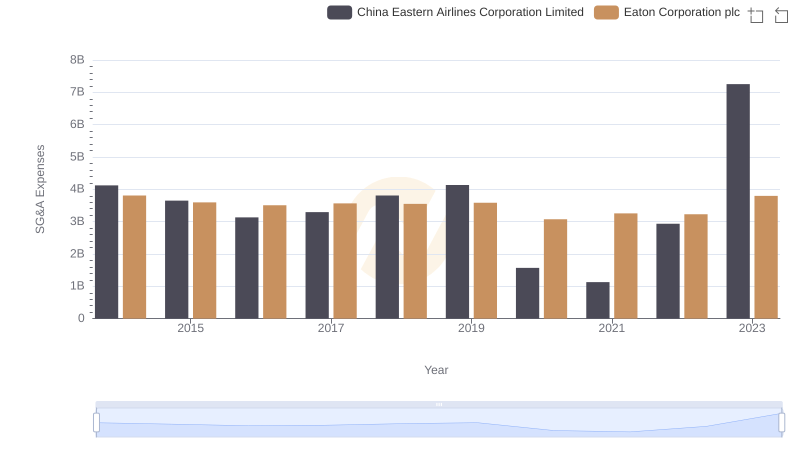
Eaton Corporation plc vs China Eastern Airlines Corporation Limited: SG&A Expense Trends
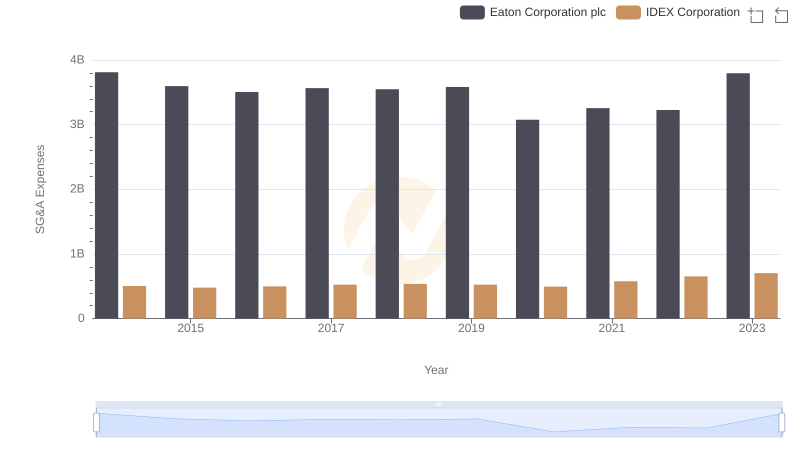
Selling, General, and Administrative Costs: Eaton Corporation plc vs IDEX Corporation

Eaton Corporation plc vs ZTO Express (Cayman) Inc.: SG&A Expense Trends

Selling, General, and Administrative Costs: Eaton Corporation plc vs Textron Inc.