| __timestamp | CSX Corporation | J.B. Hunt Transport Services, Inc. |
|---|---|---|
| Wednesday, January 1, 2014 | 9056000000 | 5124095000 |
| Thursday, January 1, 2015 | 8227000000 | 5041472000 |
| Friday, January 1, 2016 | 7680000000 | 5369826000 |
| Sunday, January 1, 2017 | 7635000000 | 5990275000 |
| Monday, January 1, 2018 | 7477000000 | 7255657000 |
| Tuesday, January 1, 2019 | 7063000000 | 7659003000 |
| Wednesday, January 1, 2020 | 6221000000 | 8186697000 |
| Friday, January 1, 2021 | 7382000000 | 10298483000 |
| Saturday, January 1, 2022 | 9068000000 | 12341472000 |
| Sunday, January 1, 2023 | 9130000000 | 10433277000 |
Unleashing insights
In the competitive world of transportation, understanding cost dynamics is crucial. Over the past decade, CSX Corporation and J.B. Hunt Transport Services, Inc. have showcased intriguing trends in their cost of revenue. From 2014 to 2023, CSX Corporation's cost of revenue fluctuated, peaking in 2023 with a 47% increase from its lowest point in 2020. Meanwhile, J.B. Hunt saw a steady rise, with a remarkable 144% growth from 2014 to 2022, before a slight dip in 2023.
This data highlights the strategic shifts and operational efficiencies these companies have adopted. While CSX managed to rebound from a low in 2020, J.B. Hunt's consistent growth underscores its robust market positioning. As the transportation sector evolves, these insights offer a glimpse into the financial strategies that drive industry leaders.
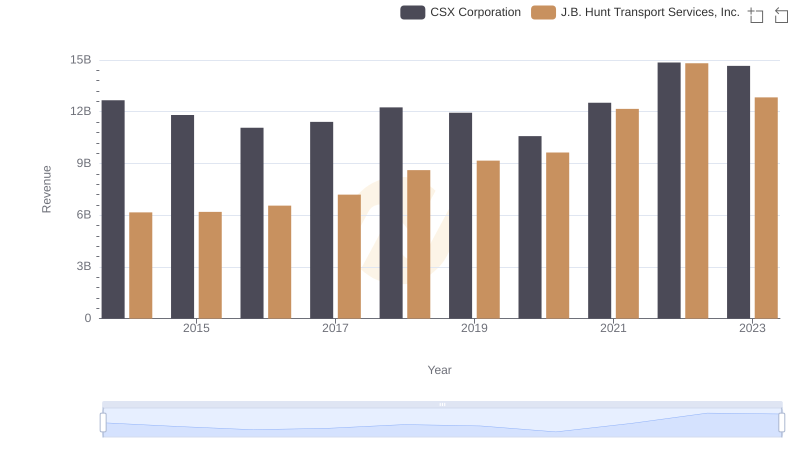
CSX Corporation or J.B. Hunt Transport Services, Inc.: Who Leads in Yearly Revenue?
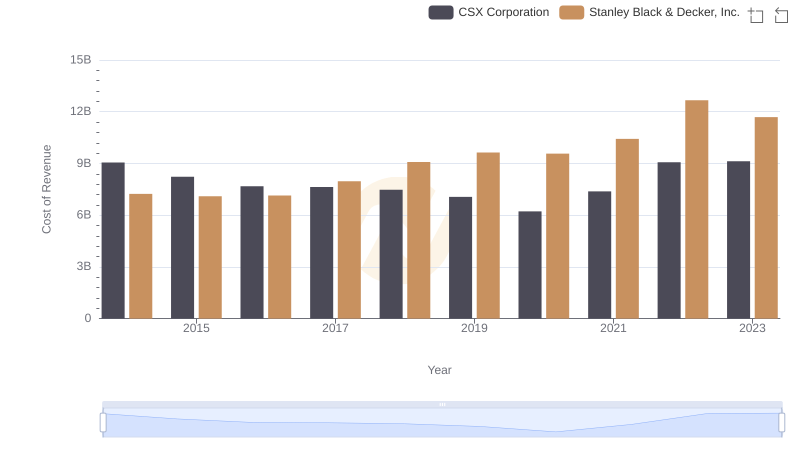
Cost Insights: Breaking Down CSX Corporation and Stanley Black & Decker, Inc.'s Expenses
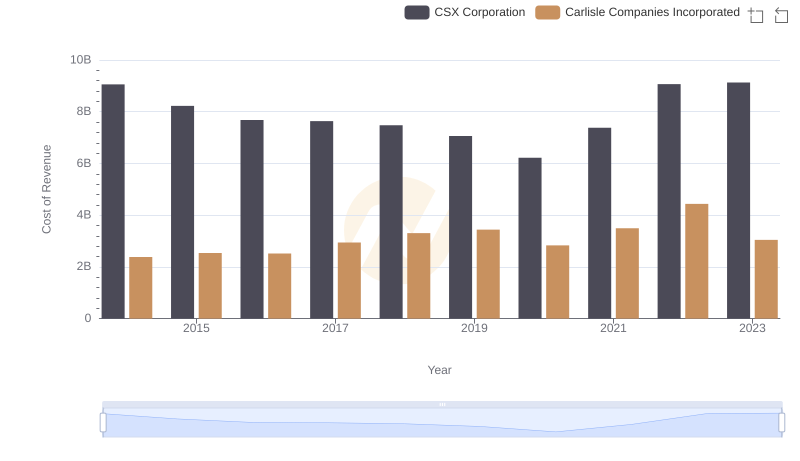
Comparing Cost of Revenue Efficiency: CSX Corporation vs Carlisle Companies Incorporated
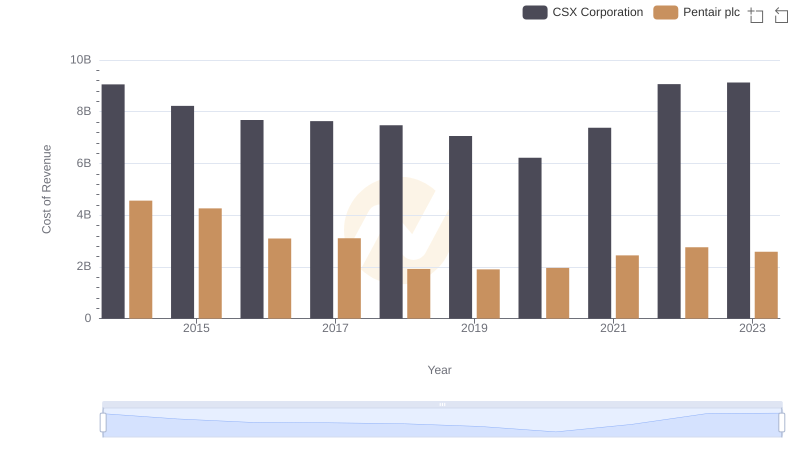
Cost of Revenue: Key Insights for CSX Corporation and Pentair plc
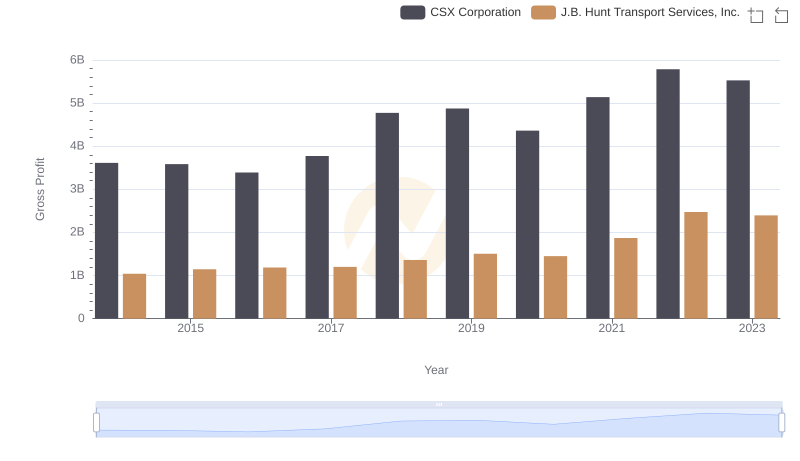
Who Generates Higher Gross Profit? CSX Corporation or J.B. Hunt Transport Services, Inc.
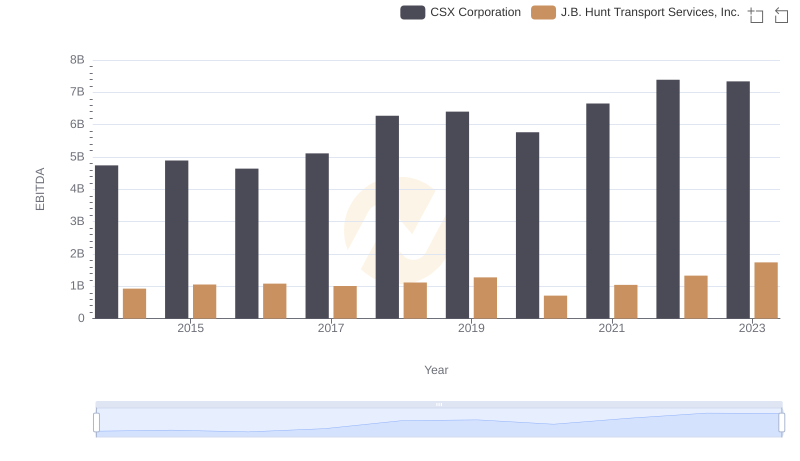
Professional EBITDA Benchmarking: CSX Corporation vs J.B. Hunt Transport Services, Inc.