| __timestamp | Cintas Corporation | Waste Management, Inc. |
|---|---|---|
| Wednesday, January 1, 2014 | 4551812000 | 13996000000 |
| Thursday, January 1, 2015 | 4476886000 | 12961000000 |
| Friday, January 1, 2016 | 4905458000 | 13609000000 |
| Sunday, January 1, 2017 | 5323381000 | 14485000000 |
| Monday, January 1, 2018 | 6476632000 | 14914000000 |
| Tuesday, January 1, 2019 | 6892303000 | 15455000000 |
| Wednesday, January 1, 2020 | 7085120000 | 15218000000 |
| Friday, January 1, 2021 | 7116340000 | 17931000000 |
| Saturday, January 1, 2022 | 7854459000 | 19698000000 |
| Sunday, January 1, 2023 | 8815769000 | 20426000000 |
| Monday, January 1, 2024 | 9596615000 | 22063000000 |
In pursuit of knowledge
In the ever-evolving landscape of American industry, Waste Management, Inc. and Cintas Corporation stand as titans in their respective fields. Over the past decade, these companies have demonstrated remarkable revenue growth, reflecting their resilience and adaptability. From 2014 to 2023, Waste Management, Inc. saw its annual revenue soar by approximately 46%, reaching a peak of $20.4 billion in 2023. Meanwhile, Cintas Corporation experienced an impressive 111% increase, culminating in a revenue of $9.6 billion in 2024.
While Waste Management, Inc. consistently outpaced Cintas in absolute revenue, Cintas's growth rate highlights its dynamic expansion strategy. The data from 2024 is incomplete for Waste Management, Inc., suggesting potential challenges or reporting delays. As these industry leaders continue to innovate, their financial trajectories offer valuable insights into the broader economic trends shaping the United States.
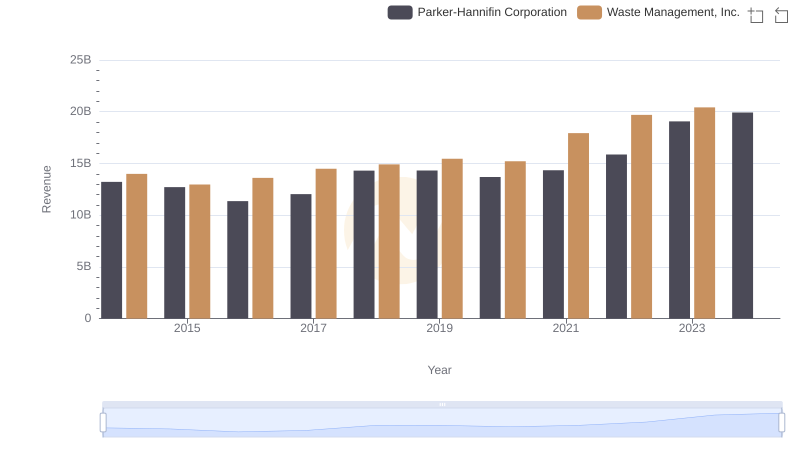
Waste Management, Inc. and Parker-Hannifin Corporation: A Comprehensive Revenue Analysis
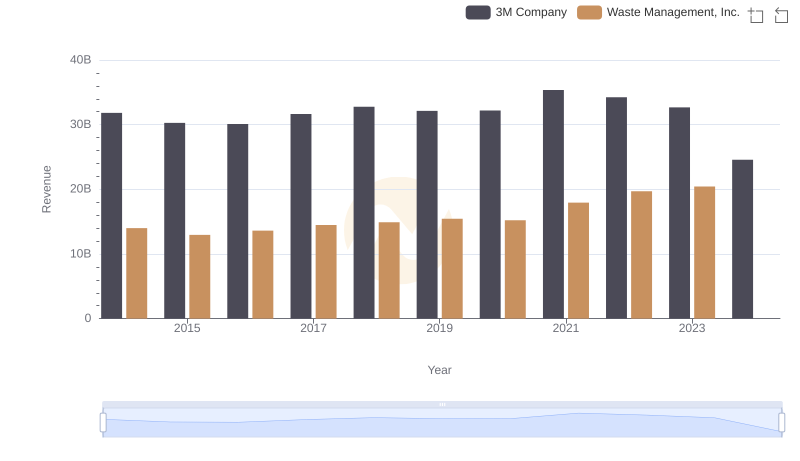
Who Generates More Revenue? Waste Management, Inc. or 3M Company
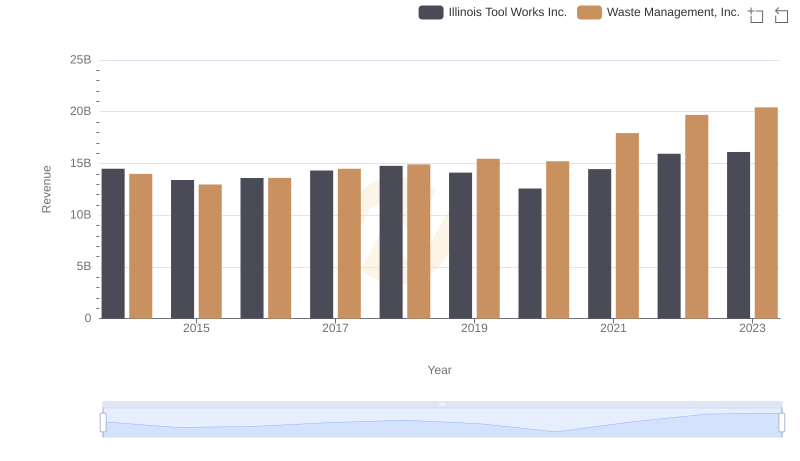
Revenue Showdown: Waste Management, Inc. vs Illinois Tool Works Inc.
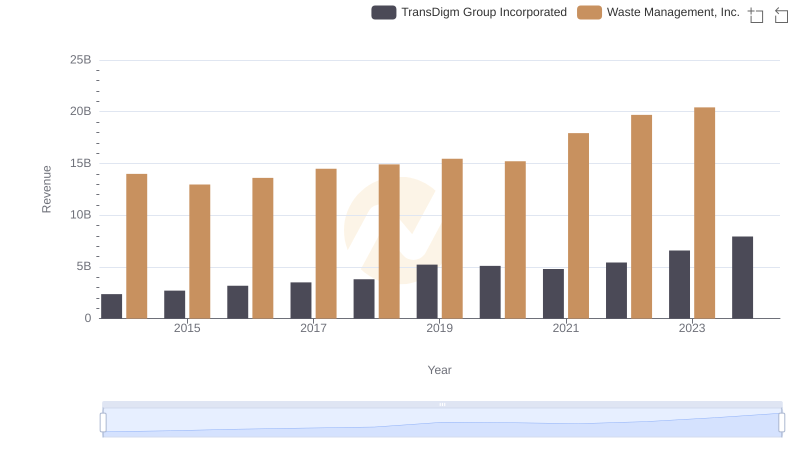
Breaking Down Revenue Trends: Waste Management, Inc. vs TransDigm Group Incorporated
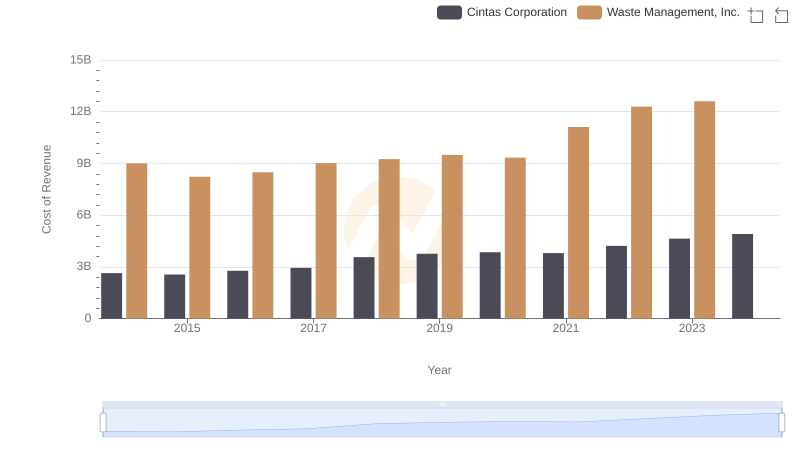
Cost of Revenue Trends: Waste Management, Inc. vs Cintas Corporation
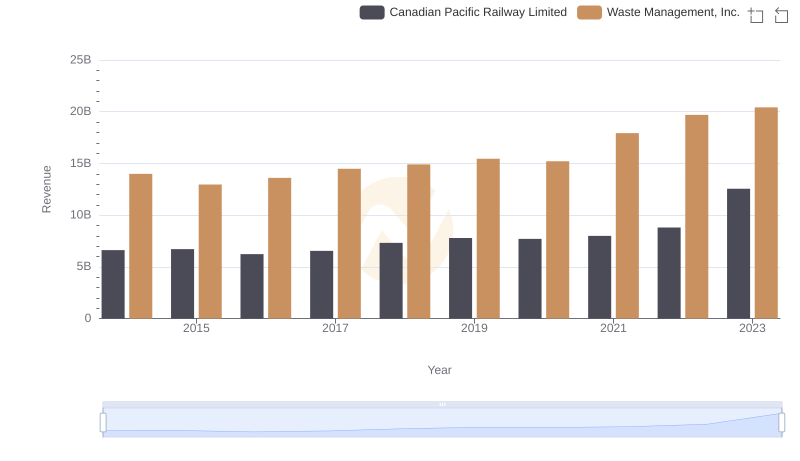
Revenue Showdown: Waste Management, Inc. vs Canadian Pacific Railway Limited
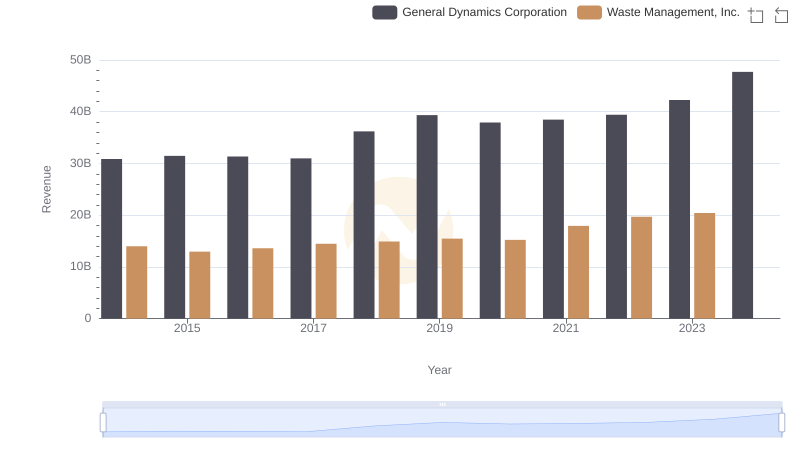
Revenue Insights: Waste Management, Inc. and General Dynamics Corporation Performance Compared
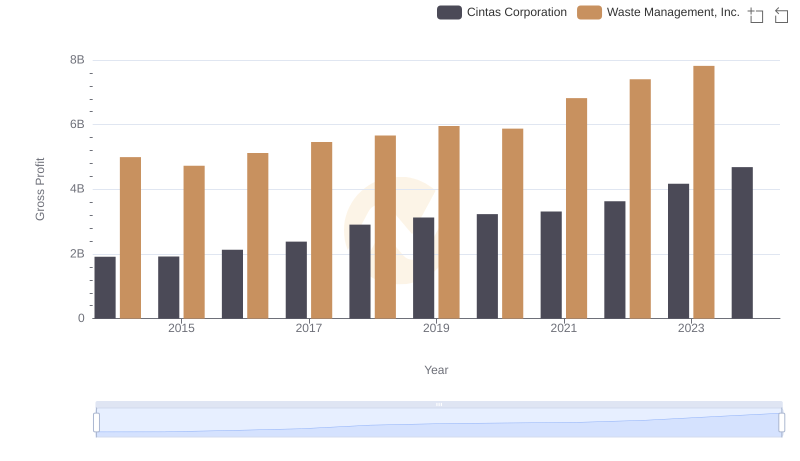
Gross Profit Comparison: Waste Management, Inc. and Cintas Corporation Trends
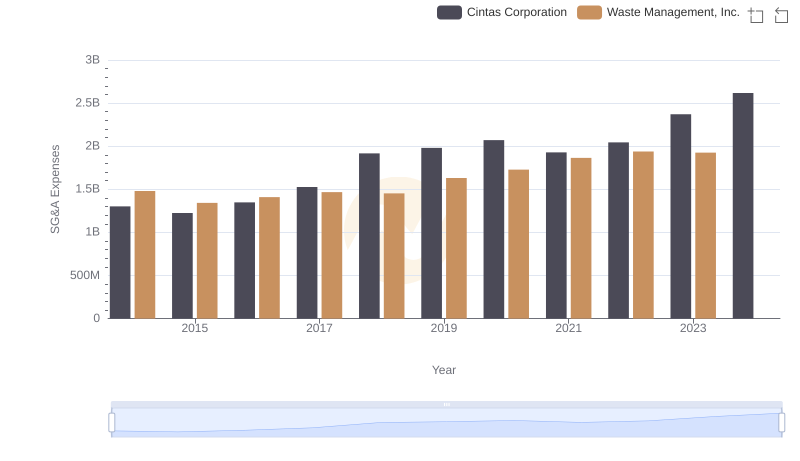
Breaking Down SG&A Expenses: Waste Management, Inc. vs Cintas Corporation