| __timestamp | Automatic Data Processing, Inc. | General Dynamics Corporation |
|---|---|---|
| Wednesday, January 1, 2014 | 7221400000 | 24979000000 |
| Thursday, January 1, 2015 | 6427600000 | 25339000000 |
| Friday, January 1, 2016 | 6840300000 | 25104000000 |
| Sunday, January 1, 2017 | 7269800000 | 24786000000 |
| Monday, January 1, 2018 | 7842600000 | 29478000000 |
| Tuesday, January 1, 2019 | 8086600000 | 32291000000 |
| Wednesday, January 1, 2020 | 8445100000 | 31600000000 |
| Friday, January 1, 2021 | 8640300000 | 32061000000 |
| Saturday, January 1, 2022 | 9461900000 | 32785000000 |
| Sunday, January 1, 2023 | 9953400000 | 35600000000 |
| Monday, January 1, 2024 | 10476700000 | 40352000000 |
Data in motion
In the ever-evolving landscape of corporate finance, understanding cost structures is pivotal. This analysis delves into the cost of revenue trends for Automatic Data Processing, Inc. (ADP) and General Dynamics Corporation (GD) from 2014 to 2023. Over this decade, ADP's cost of revenue has shown a steady increase, rising approximately 45% from 2014 to 2023. This upward trajectory reflects ADP's expanding operations and strategic investments. In contrast, GD's cost of revenue has experienced fluctuations, peaking in 2023 with a 42% increase from 2014, before a notable absence of data in 2024. This missing data could indicate a strategic shift or reporting anomaly. Such insights are crucial for investors and analysts aiming to understand the financial health and strategic direction of these industry giants. As we move forward, monitoring these trends will be essential for predicting future performance and making informed investment decisions.
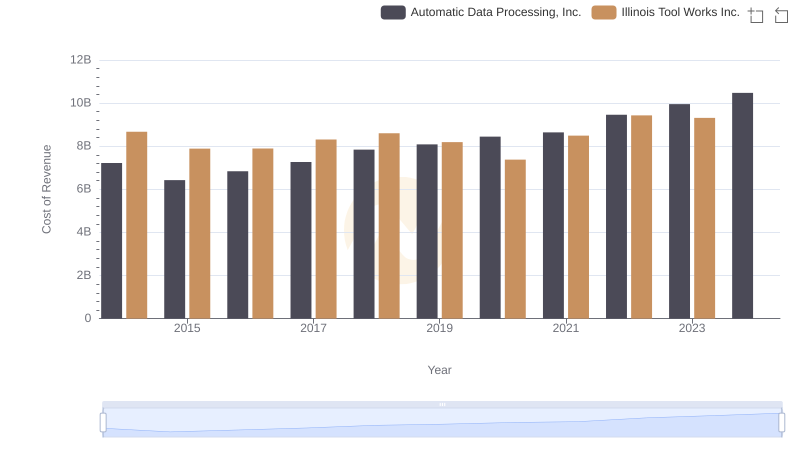
Comparing Cost of Revenue Efficiency: Automatic Data Processing, Inc. vs Illinois Tool Works Inc.
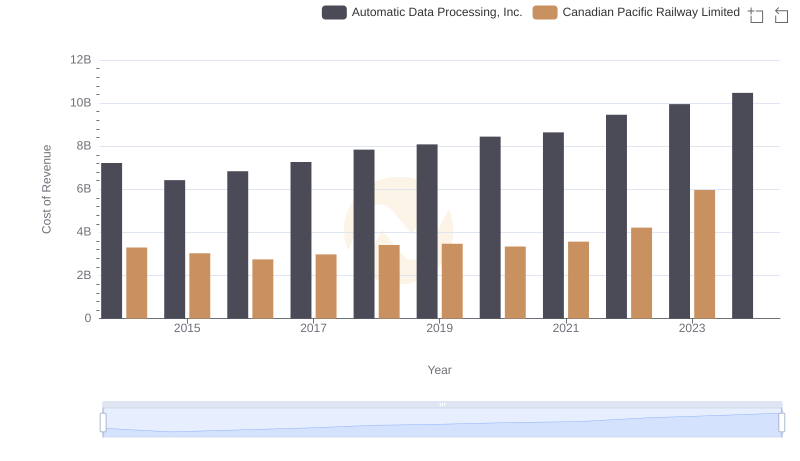
Cost Insights: Breaking Down Automatic Data Processing, Inc. and Canadian Pacific Railway Limited's Expenses
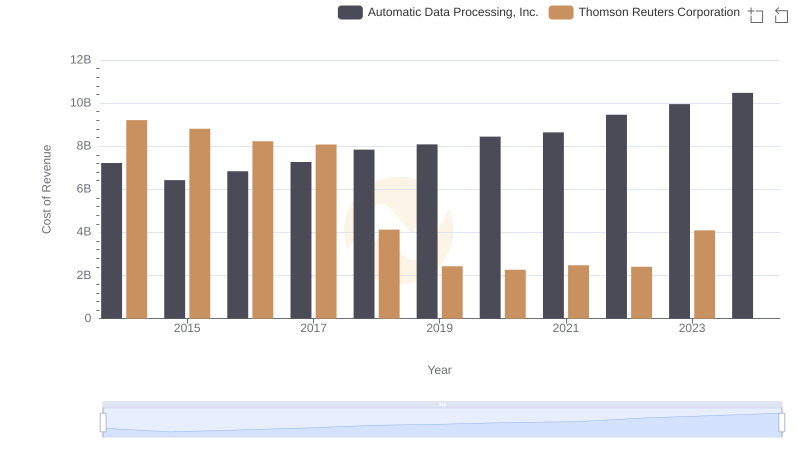
Cost of Revenue Comparison: Automatic Data Processing, Inc. vs Thomson Reuters Corporation
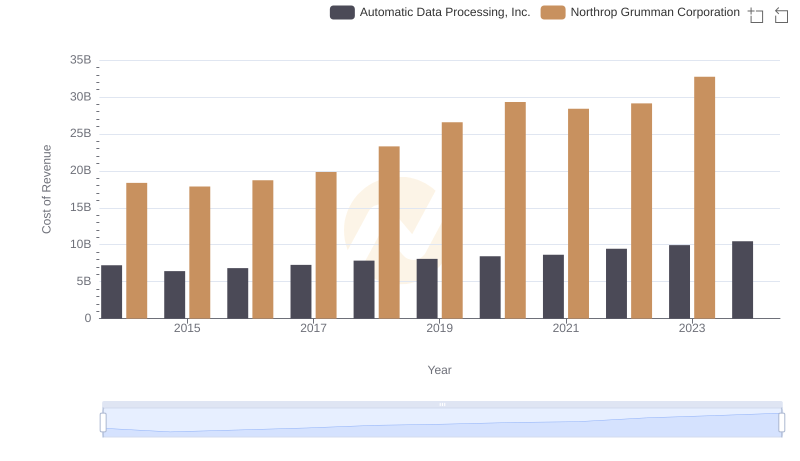
Automatic Data Processing, Inc. vs Northrop Grumman Corporation: Efficiency in Cost of Revenue Explored
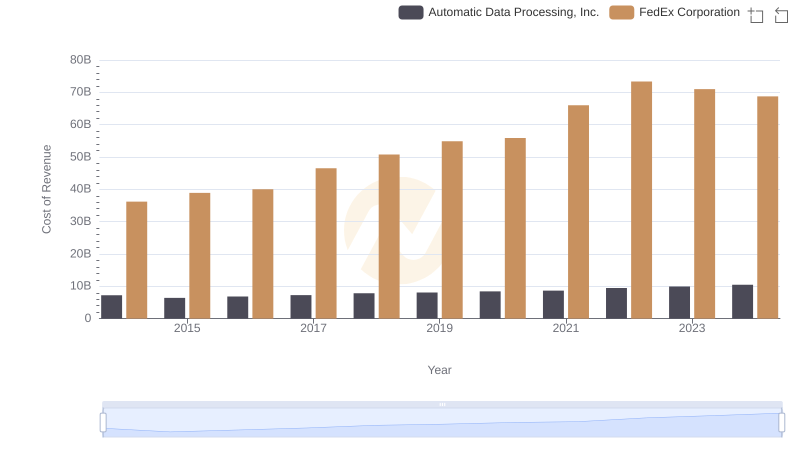
Cost Insights: Breaking Down Automatic Data Processing, Inc. and FedEx Corporation's Expenses
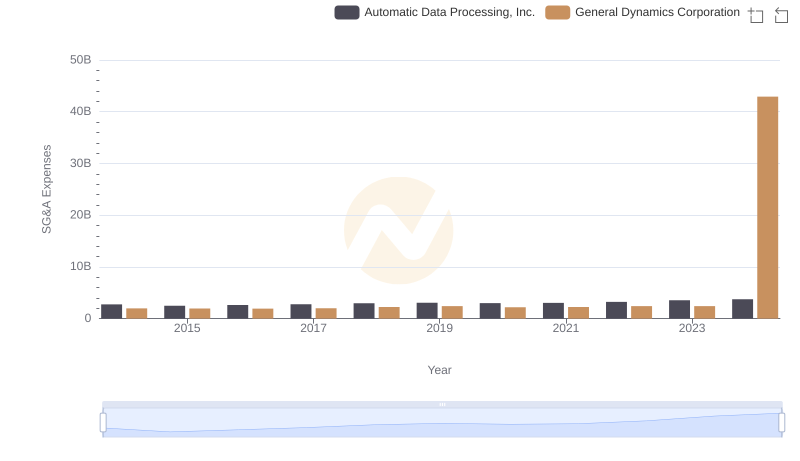
Automatic Data Processing, Inc. or General Dynamics Corporation: Who Manages SG&A Costs Better?
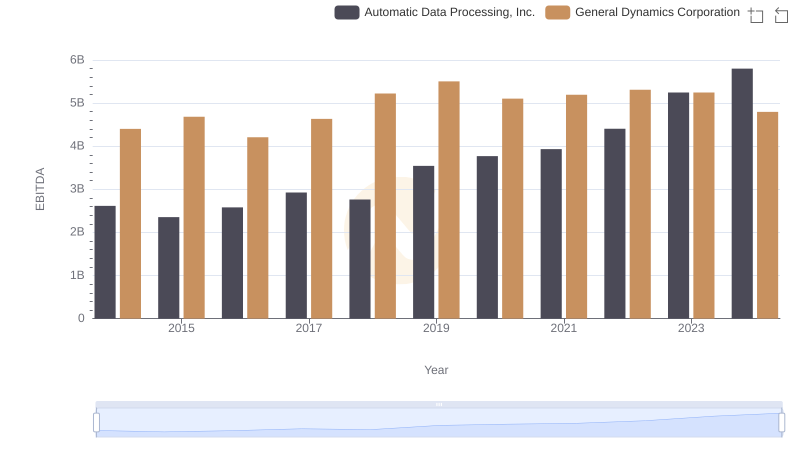
A Professional Review of EBITDA: Automatic Data Processing, Inc. Compared to General Dynamics Corporation