| __timestamp | 3M Company | Ryanair Holdings plc |
|---|---|---|
| Wednesday, January 1, 2014 | 16447000000 | 3838100000 |
| Thursday, January 1, 2015 | 15383000000 | 3999600000 |
| Friday, January 1, 2016 | 15040000000 | 4355900000 |
| Sunday, January 1, 2017 | 16001000000 | 4294000000 |
| Monday, January 1, 2018 | 16682000000 | 4512300000 |
| Tuesday, January 1, 2019 | 17136000000 | 5492800000 |
| Wednesday, January 1, 2020 | 16605000000 | 6039900000 |
| Friday, January 1, 2021 | 18795000000 | 1702700000 |
| Saturday, January 1, 2022 | 19232000000 | 4009800000 |
| Sunday, January 1, 2023 | 18477000000 | 7735000000 |
| Monday, January 1, 2024 | 14447000000 | 9566400000 |
Data in motion
In the ever-evolving landscape of global business, understanding cost dynamics is crucial. This analysis delves into the cost of revenue trends for two industry titans: 3M Company and Ryanair Holdings plc, from 2014 to 2024.
3M, a stalwart in manufacturing, saw its cost of revenue fluctuate, peaking in 2022 with a 15% increase from 2014, before a notable 25% drop in 2024. Meanwhile, Ryanair, Europe's budget airline leader, experienced a dramatic 150% surge in costs from 2014 to 2024, reflecting its aggressive expansion strategy.
The data reveals a stark contrast in cost management strategies. While 3M's costs remained relatively stable, Ryanair's volatility underscores the challenges of scaling in the competitive airline industry. These insights offer a window into the strategic decisions shaping these companies' futures.
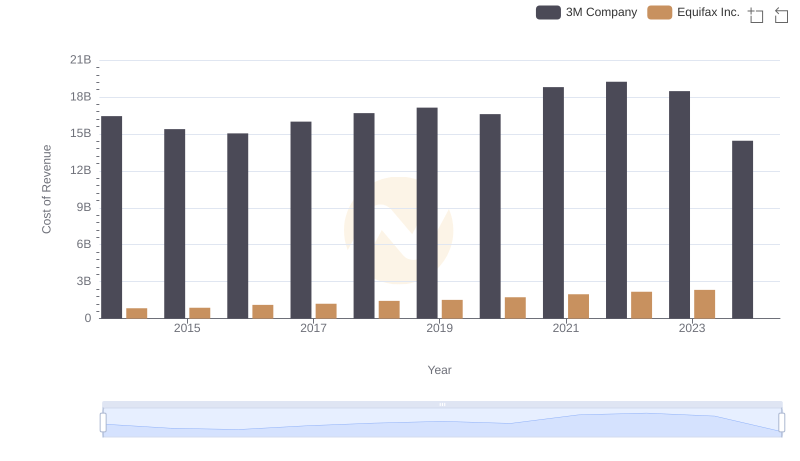
Cost of Revenue Comparison: 3M Company vs Equifax Inc.
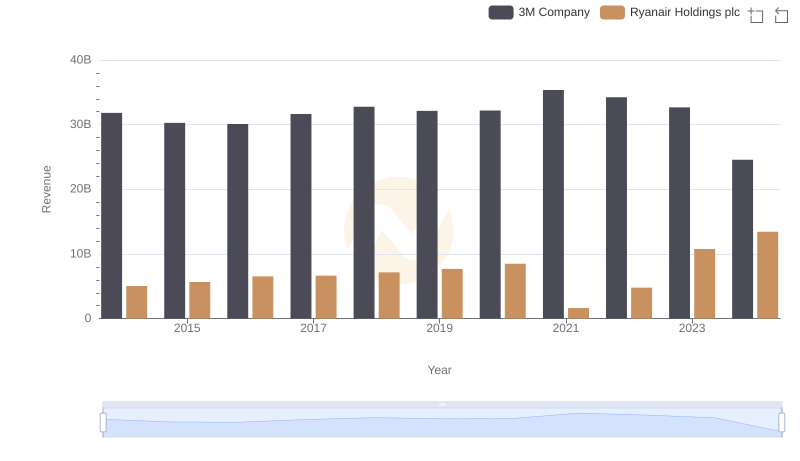
Breaking Down Revenue Trends: 3M Company vs Ryanair Holdings plc
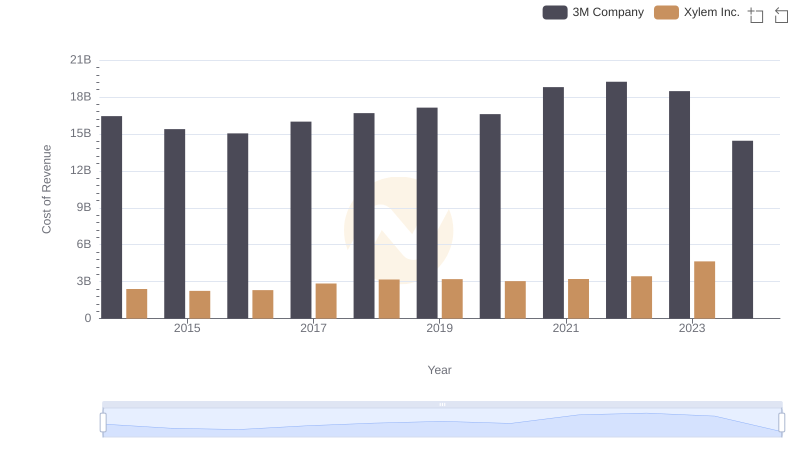
3M Company vs Xylem Inc.: Efficiency in Cost of Revenue Explored
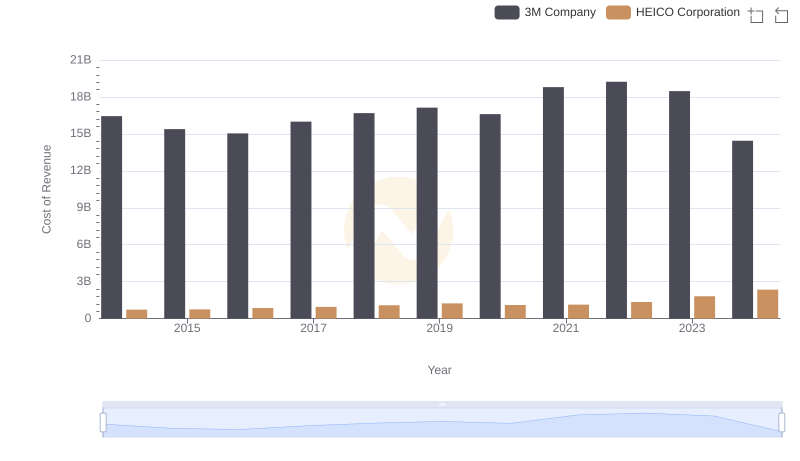
Comparing Cost of Revenue Efficiency: 3M Company vs HEICO Corporation
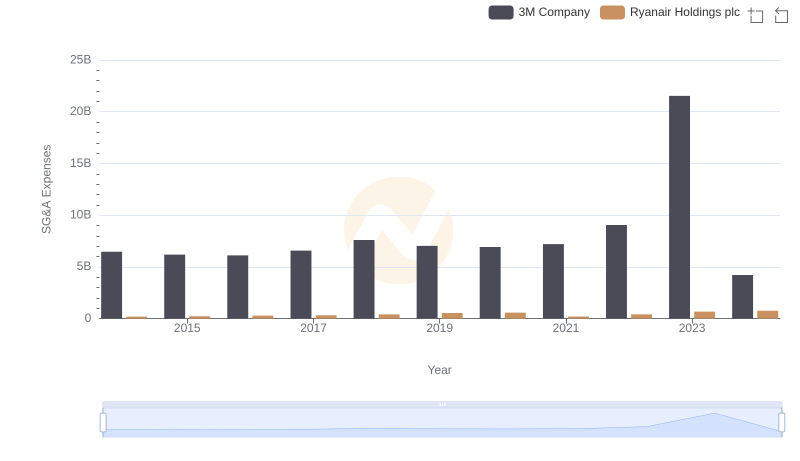
Breaking Down SG&A Expenses: 3M Company vs Ryanair Holdings plc
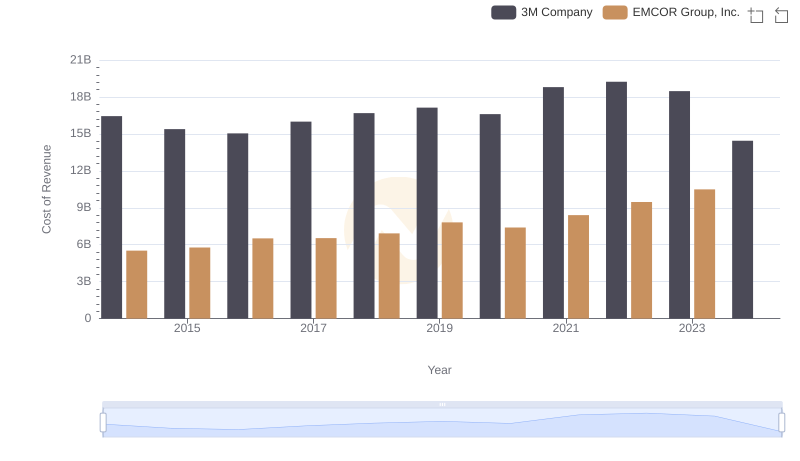
3M Company vs EMCOR Group, Inc.: Efficiency in Cost of Revenue Explored