| __timestamp | Caterpillar Inc. | Eaton Corporation plc |
|---|---|---|
| Wednesday, January 1, 2014 | 55184000000 | 22552000000 |
| Thursday, January 1, 2015 | 47011000000 | 20855000000 |
| Friday, January 1, 2016 | 38537000000 | 19747000000 |
| Sunday, January 1, 2017 | 45462000000 | 20404000000 |
| Monday, January 1, 2018 | 54722000000 | 21609000000 |
| Tuesday, January 1, 2019 | 53800000000 | 21390000000 |
| Wednesday, January 1, 2020 | 41748000000 | 17858000000 |
| Friday, January 1, 2021 | 50971000000 | 19628000000 |
| Saturday, January 1, 2022 | 59427000000 | 20752000000 |
| Sunday, January 1, 2023 | 67060000000 | 23196000000 |
| Monday, January 1, 2024 | 64809000000 | 24878000000 |
Unleashing the power of data
In the competitive landscape of industrial manufacturing, Caterpillar Inc. and Eaton Corporation plc have showcased remarkable revenue trajectories over the past decade. From 2014 to 2023, Caterpillar's revenue surged by approximately 22%, peaking in 2023 with a notable $67 billion. This growth reflects Caterpillar's resilience and strategic market positioning, especially in the face of global economic fluctuations.
Conversely, Eaton Corporation plc demonstrated steady growth, with a 3% increase in revenue over the same period, reaching $23 billion in 2023. Eaton's consistent performance underscores its robust business model and adaptability in the ever-evolving industrial sector.
These insights not only highlight the financial prowess of these industry leaders but also offer a glimpse into the broader economic trends influencing the industrial manufacturing sector. As we look to the future, the strategic decisions made by these companies will undoubtedly shape their continued success.
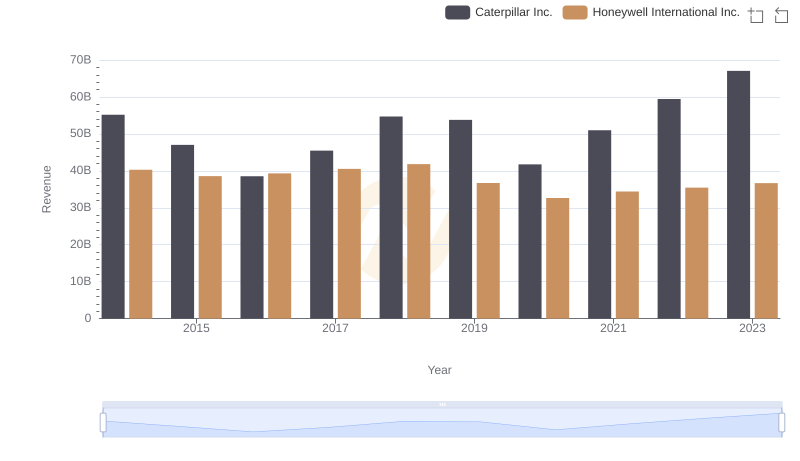
Caterpillar Inc. vs Honeywell International Inc.: Annual Revenue Growth Compared

Revenue Insights: Caterpillar Inc. and Deere & Company Performance Compared

Breaking Down Revenue Trends: Caterpillar Inc. vs The Boeing Company
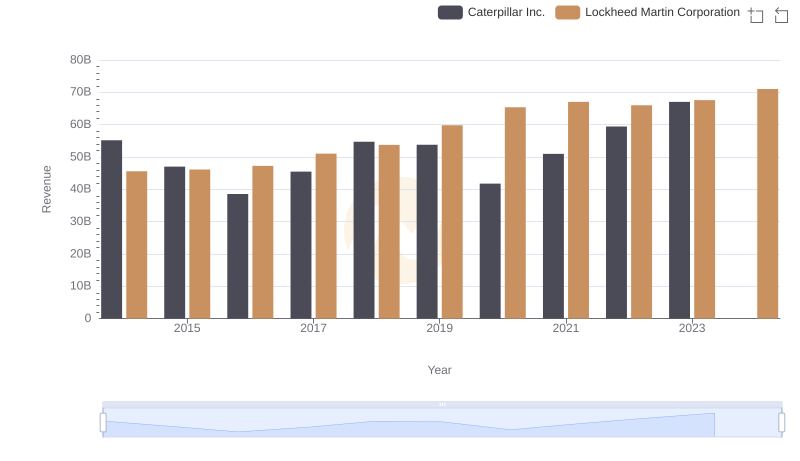
Caterpillar Inc. vs Lockheed Martin Corporation: Examining Key Revenue Metrics
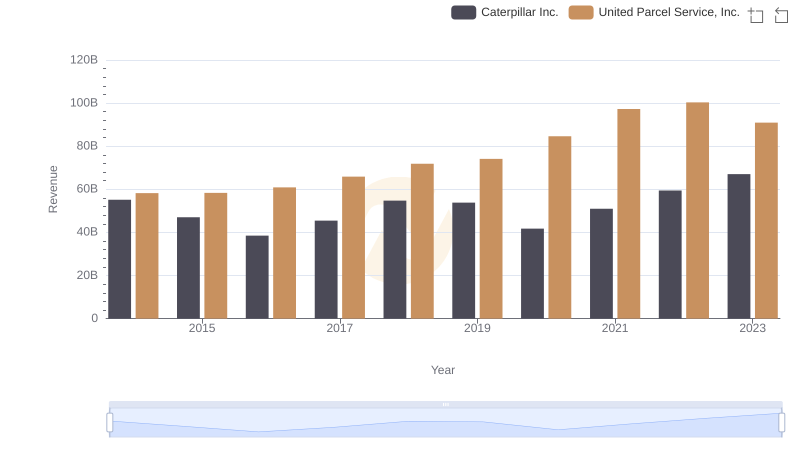
Who Generates More Revenue? Caterpillar Inc. or United Parcel Service, Inc.

Cost of Revenue: Key Insights for Caterpillar Inc. and Eaton Corporation plc

Breaking Down Revenue Trends: Caterpillar Inc. vs Parker-Hannifin Corporation
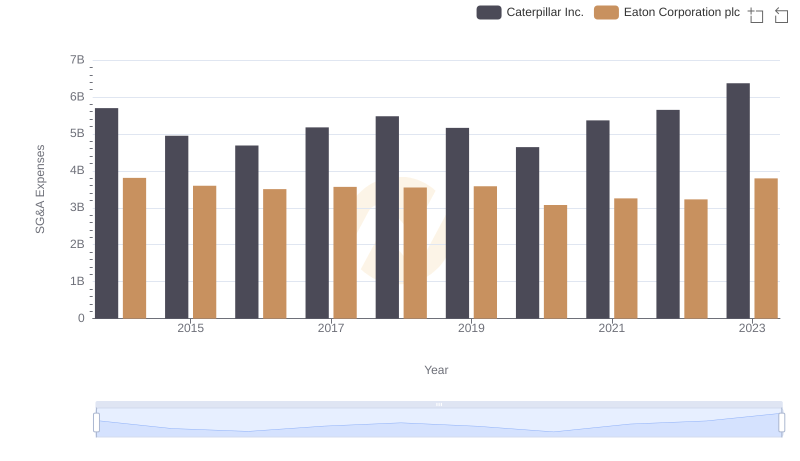
Caterpillar Inc. or Eaton Corporation plc: Who Manages SG&A Costs Better?
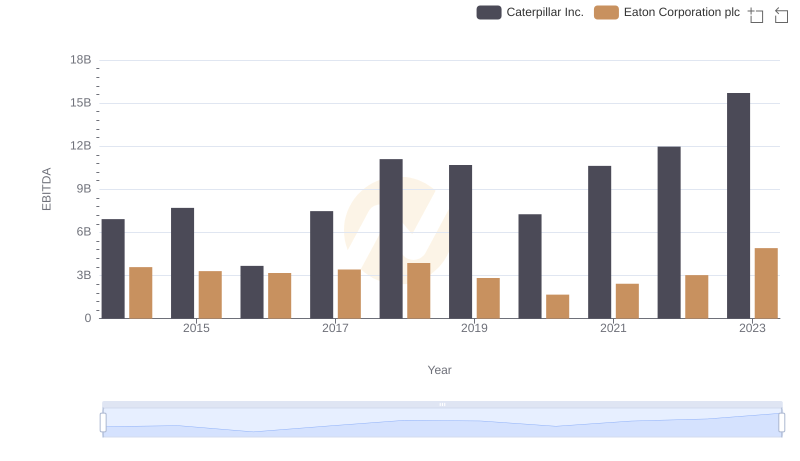
Caterpillar Inc. and Eaton Corporation plc: A Detailed Examination of EBITDA Performance