| __timestamp | Caterpillar Inc. | Eaton Corporation plc |
|---|---|---|
| Wednesday, January 1, 2014 | 6929000000 | 3586000000 |
| Thursday, January 1, 2015 | 7705000000 | 3302000000 |
| Friday, January 1, 2016 | 3671000000 | 3176000000 |
| Sunday, January 1, 2017 | 7482000000 | 3418000000 |
| Monday, January 1, 2018 | 11102000000 | 3875000000 |
| Tuesday, January 1, 2019 | 10690000000 | 2827000000 |
| Wednesday, January 1, 2020 | 7267000000 | 1674000000 |
| Friday, January 1, 2021 | 10627000000 | 2423000000 |
| Saturday, January 1, 2022 | 11974000000 | 3031000000 |
| Sunday, January 1, 2023 | 15705000000 | 4904000000 |
| Monday, January 1, 2024 | 16038000000 | 5547999771 |
Data in motion
In the ever-evolving landscape of industrial giants, Caterpillar Inc. and Eaton Corporation plc have showcased remarkable EBITDA performance over the past decade. From 2014 to 2023, Caterpillar's EBITDA surged by approximately 127%, peaking in 2023 with a notable increase of 31% from the previous year. This growth trajectory underscores Caterpillar's resilience and strategic prowess in navigating market challenges.
Conversely, Eaton Corporation plc experienced a more modest EBITDA growth of around 37% over the same period. Despite a dip in 2020, Eaton rebounded strongly, achieving its highest EBITDA in 2023, marking a 62% increase from the previous year. This recovery highlights Eaton's adaptability and commitment to innovation.
These insights reveal the dynamic nature of the industrial sector, where strategic investments and market adaptability are key to sustained growth.
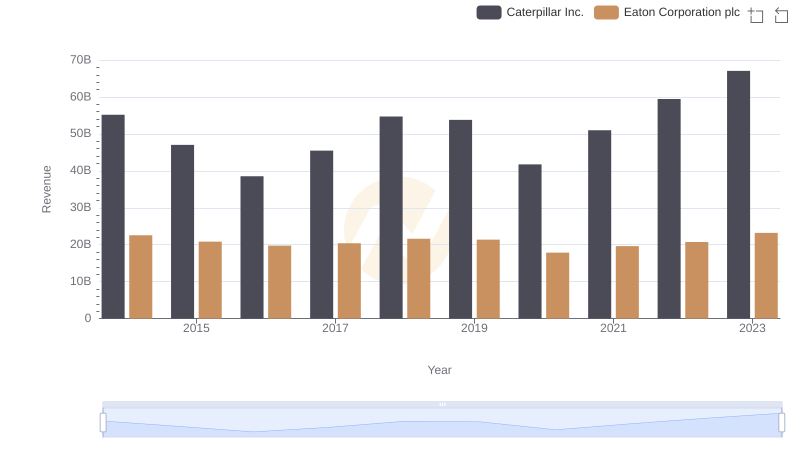
Revenue Insights: Caterpillar Inc. and Eaton Corporation plc Performance Compared

Cost of Revenue: Key Insights for Caterpillar Inc. and Eaton Corporation plc
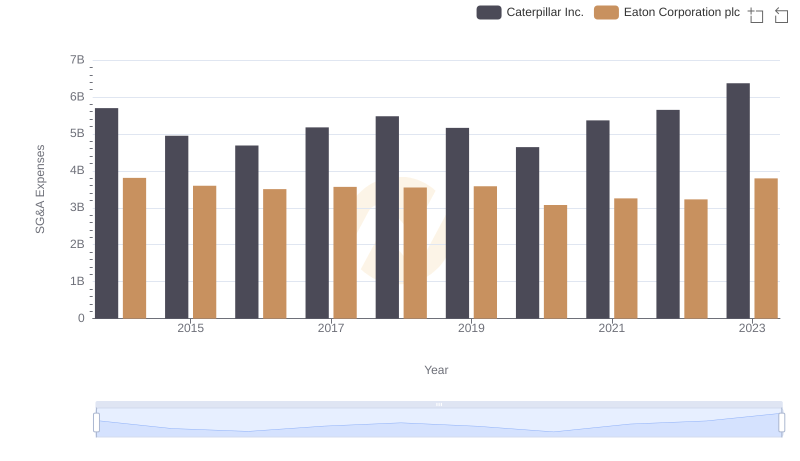
Caterpillar Inc. or Eaton Corporation plc: Who Manages SG&A Costs Better?
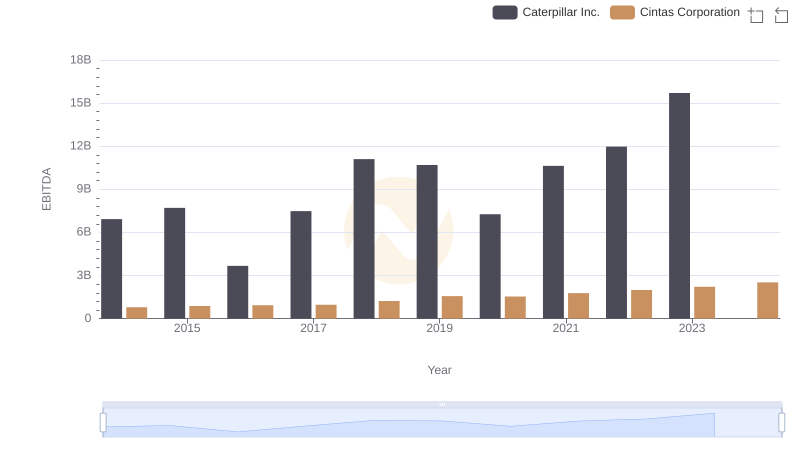
A Professional Review of EBITDA: Caterpillar Inc. Compared to Cintas Corporation
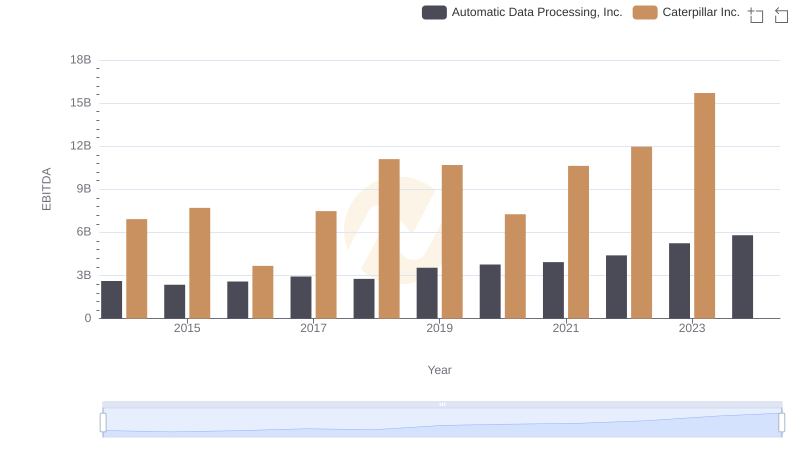
Professional EBITDA Benchmarking: Caterpillar Inc. vs Automatic Data Processing, Inc.

Comparative EBITDA Analysis: Caterpillar Inc. vs Trane Technologies plc