| __timestamp | 3M Company | Caterpillar Inc. |
|---|---|---|
| Wednesday, January 1, 2014 | 16447000000 | 40391000000 |
| Thursday, January 1, 2015 | 15383000000 | 34133000000 |
| Friday, January 1, 2016 | 15040000000 | 28905000000 |
| Sunday, January 1, 2017 | 16001000000 | 31695000000 |
| Monday, January 1, 2018 | 16682000000 | 37719000000 |
| Tuesday, January 1, 2019 | 17136000000 | 37384000000 |
| Wednesday, January 1, 2020 | 16605000000 | 29671000000 |
| Friday, January 1, 2021 | 18795000000 | 35968000000 |
| Saturday, January 1, 2022 | 19232000000 | 41915000000 |
| Sunday, January 1, 2023 | 18477000000 | 43797000000 |
| Monday, January 1, 2024 | 14447000000 | 41485000000 |
Cracking the code
In the world of industrial manufacturing, Caterpillar Inc. and 3M Company stand as titans. Over the past decade, these companies have navigated the complexities of global markets, with their cost of revenue reflecting their strategic maneuvers. From 2014 to 2023, Caterpillar's cost of revenue has shown a remarkable 8% increase, peaking in 2023. In contrast, 3M's cost of revenue has fluctuated, with a notable 17% rise from 2016 to 2022, before a slight dip in 2023. This divergence highlights Caterpillar's consistent growth strategy, while 3M's adaptability to market changes is evident. Interestingly, data for 2024 is incomplete, leaving room for speculation on future trends. As these industry leaders continue to evolve, their financial strategies offer valuable insights into the broader economic landscape.

Caterpillar Inc. vs 3M Company: Examining Key Revenue Metrics

Caterpillar Inc. vs United Parcel Service, Inc.: Efficiency in Cost of Revenue Explored

Caterpillar Inc. vs Automatic Data Processing, Inc.: Efficiency in Cost of Revenue Explored
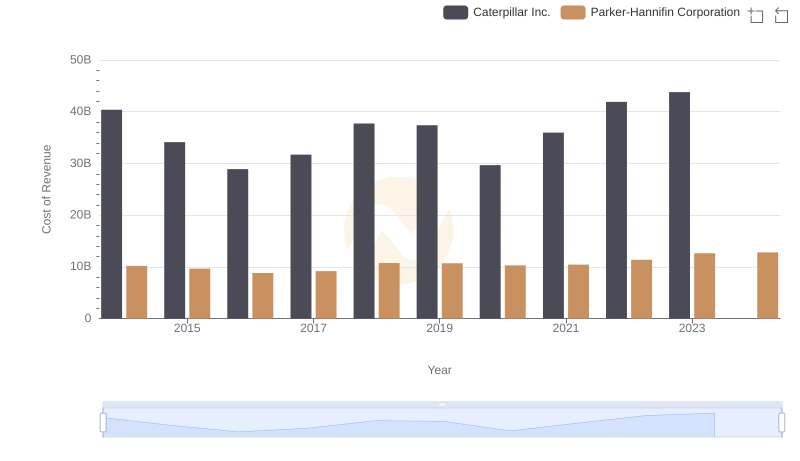
Cost of Revenue Comparison: Caterpillar Inc. vs Parker-Hannifin Corporation
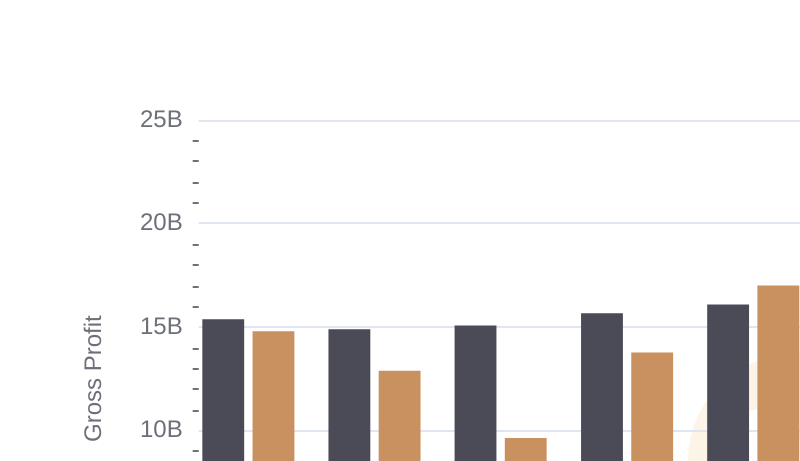
Caterpillar Inc. vs 3M Company: A Gross Profit Performance Breakdown
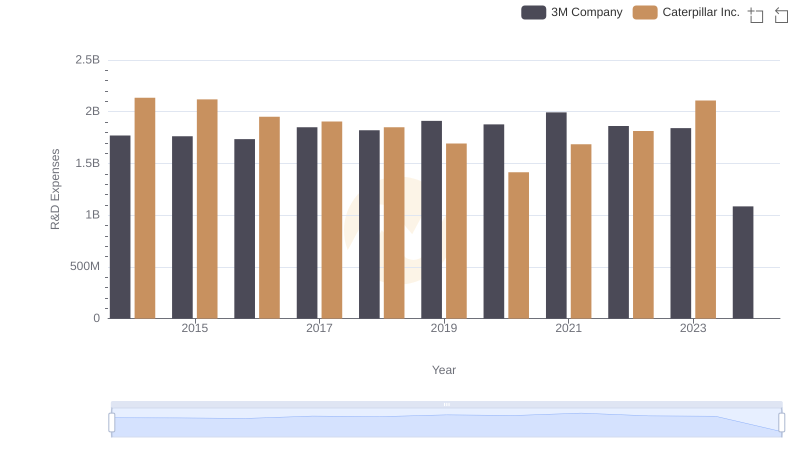
R&D Spending Showdown: Caterpillar Inc. vs 3M Company