| __timestamp | 3M Company | Caterpillar Inc. |
|---|---|---|
| Wednesday, January 1, 2014 | 31821000000 | 55184000000 |
| Thursday, January 1, 2015 | 30274000000 | 47011000000 |
| Friday, January 1, 2016 | 30109000000 | 38537000000 |
| Sunday, January 1, 2017 | 31657000000 | 45462000000 |
| Monday, January 1, 2018 | 32765000000 | 54722000000 |
| Tuesday, January 1, 2019 | 32136000000 | 53800000000 |
| Wednesday, January 1, 2020 | 32184000000 | 41748000000 |
| Friday, January 1, 2021 | 35355000000 | 50971000000 |
| Saturday, January 1, 2022 | 34229000000 | 59427000000 |
| Sunday, January 1, 2023 | 32681000000 | 67060000000 |
| Monday, January 1, 2024 | 24575000000 | 64809000000 |
Unlocking the unknown
In the ever-evolving landscape of industrial giants, Caterpillar Inc. and 3M Company have long been titans of industry. From 2014 to 2023, these two companies have showcased intriguing revenue trends. Caterpillar Inc. has demonstrated a robust growth trajectory, with its revenue peaking at approximately $67 billion in 2023, marking a significant increase of over 70% from its lowest point in 2016. In contrast, 3M Company has experienced a more stable revenue pattern, with a peak in 2021 at around $35 billion, before a notable dip in 2024. This divergence highlights Caterpillar's resilience and adaptability in a competitive market, while 3M's consistency underscores its steady market presence. As we look to the future, these trends offer valuable insights into the strategic maneuvers of these industrial powerhouses.
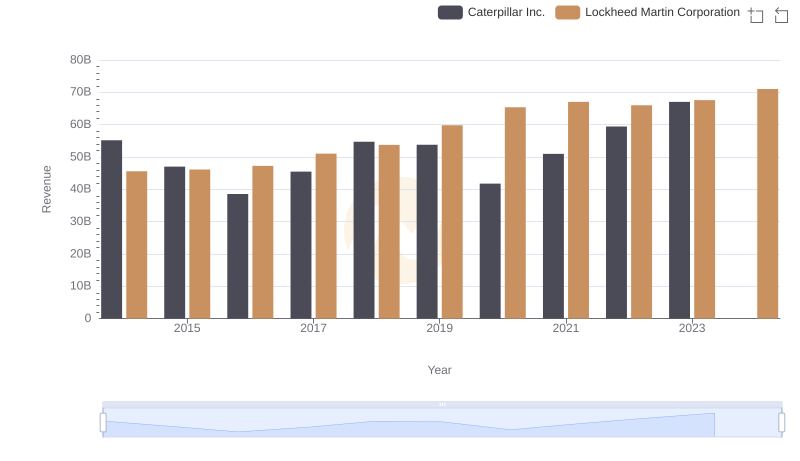
Caterpillar Inc. vs Lockheed Martin Corporation: Examining Key Revenue Metrics
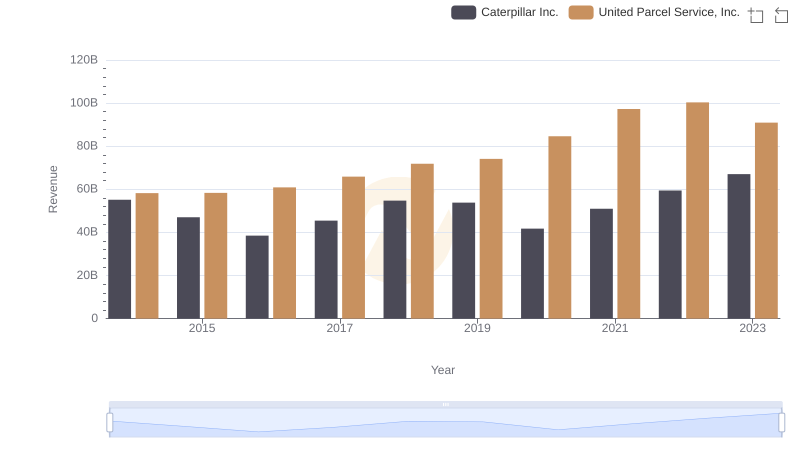
Who Generates More Revenue? Caterpillar Inc. or United Parcel Service, Inc.

Breaking Down Revenue Trends: Caterpillar Inc. vs Parker-Hannifin Corporation
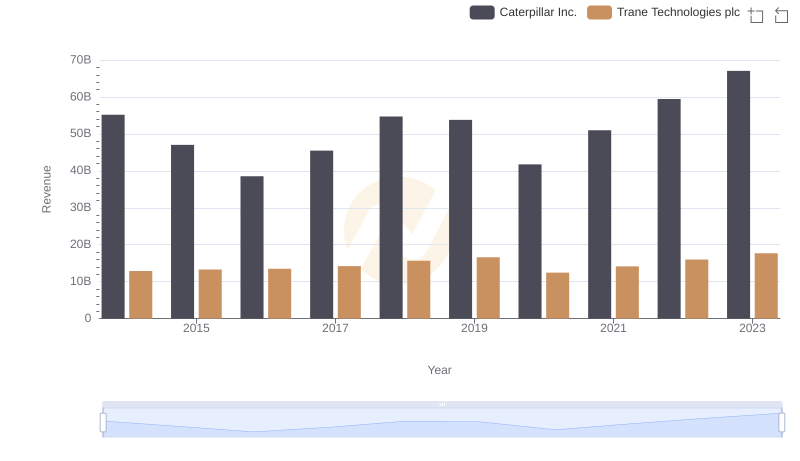
Who Generates More Revenue? Caterpillar Inc. or Trane Technologies plc

Caterpillar Inc. vs TransDigm Group Incorporated: Annual Revenue Growth Compared
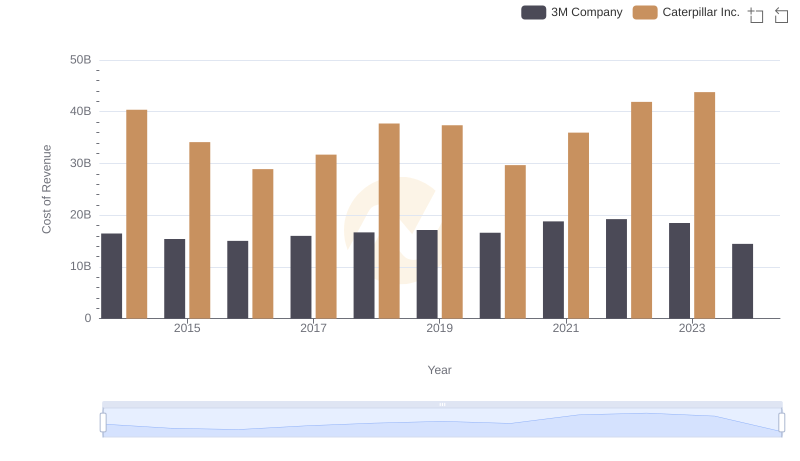
Cost of Revenue Comparison: Caterpillar Inc. vs 3M Company
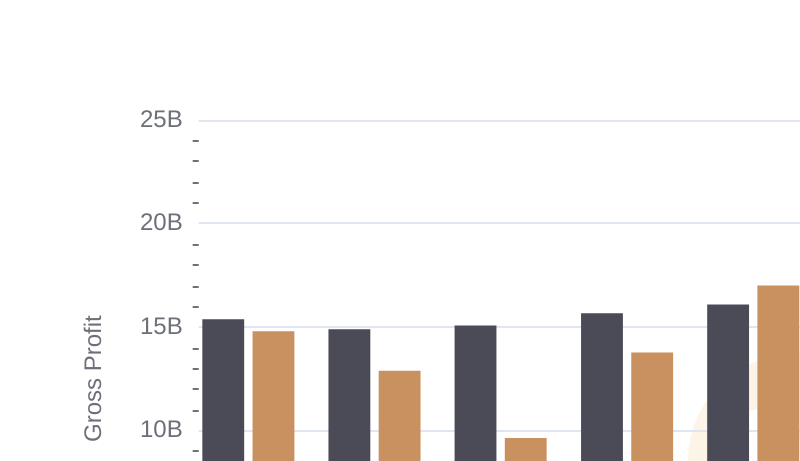
Caterpillar Inc. vs 3M Company: A Gross Profit Performance Breakdown
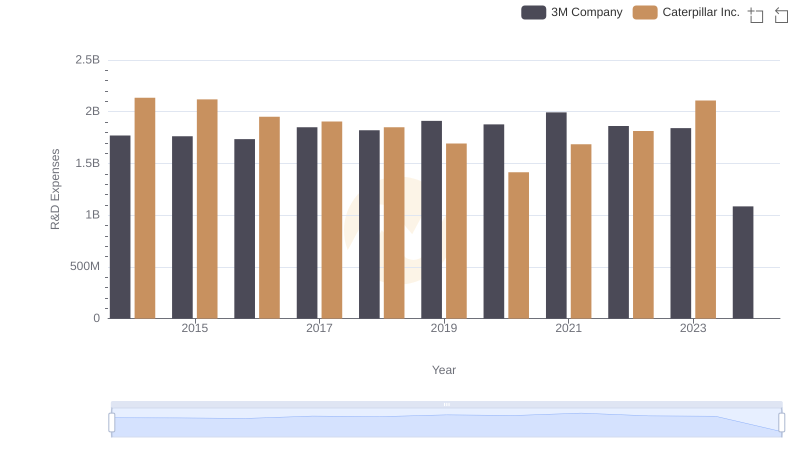
R&D Spending Showdown: Caterpillar Inc. vs 3M Company