| __timestamp | 3M Company | Caterpillar Inc. |
|---|---|---|
| Wednesday, January 1, 2014 | 15374000000 | 14793000000 |
| Thursday, January 1, 2015 | 14891000000 | 12878000000 |
| Friday, January 1, 2016 | 15069000000 | 9632000000 |
| Sunday, January 1, 2017 | 15656000000 | 13767000000 |
| Monday, January 1, 2018 | 16083000000 | 17003000000 |
| Tuesday, January 1, 2019 | 15000000000 | 16416000000 |
| Wednesday, January 1, 2020 | 15579000000 | 12077000000 |
| Friday, January 1, 2021 | 16560000000 | 15003000000 |
| Saturday, January 1, 2022 | 14997000000 | 17512000000 |
| Sunday, January 1, 2023 | 14204000000 | 23263000000 |
| Monday, January 1, 2024 | 10128000000 | 23324000000 |
In pursuit of knowledge
In the ever-evolving landscape of industrial giants, Caterpillar Inc. and 3M Company have long been titans of their respective fields. Over the past decade, these two companies have showcased intriguing trends in their gross profit performance. From 2014 to 2023, Caterpillar Inc. has seen a remarkable 57% increase in gross profit, peaking in 2023 with a staggering $23.3 billion. In contrast, 3M Company experienced a more modest growth, with a 7% increase over the same period, reaching its highest gross profit in 2021.
While 3M's performance remained relatively stable, Caterpillar's trajectory was more volatile, reflecting its adaptability and resilience in a competitive market. Notably, 2024 data for Caterpillar is missing, leaving room for speculation on its future performance. This comparison not only highlights the financial prowess of these industrial leaders but also underscores the dynamic nature of the global market.

Caterpillar Inc. vs 3M Company: Examining Key Revenue Metrics
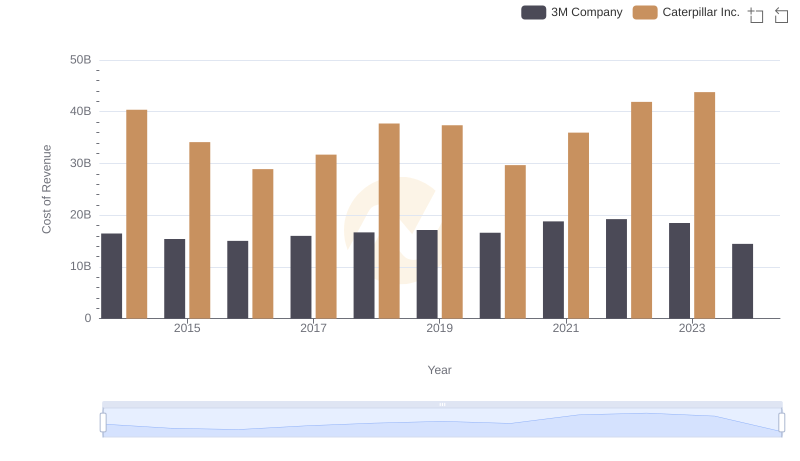
Cost of Revenue Comparison: Caterpillar Inc. vs 3M Company

Who Generates Higher Gross Profit? Caterpillar Inc. or Automatic Data Processing, Inc.
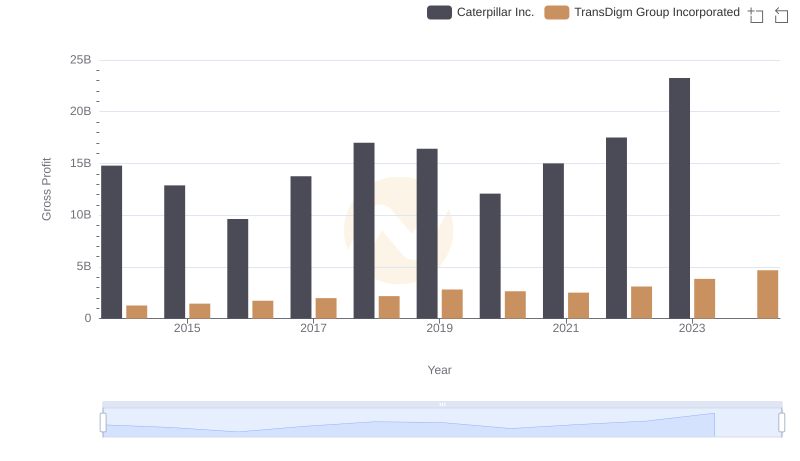
Who Generates Higher Gross Profit? Caterpillar Inc. or TransDigm Group Incorporated

Caterpillar Inc. vs Illinois Tool Works Inc.: A Gross Profit Performance Breakdown
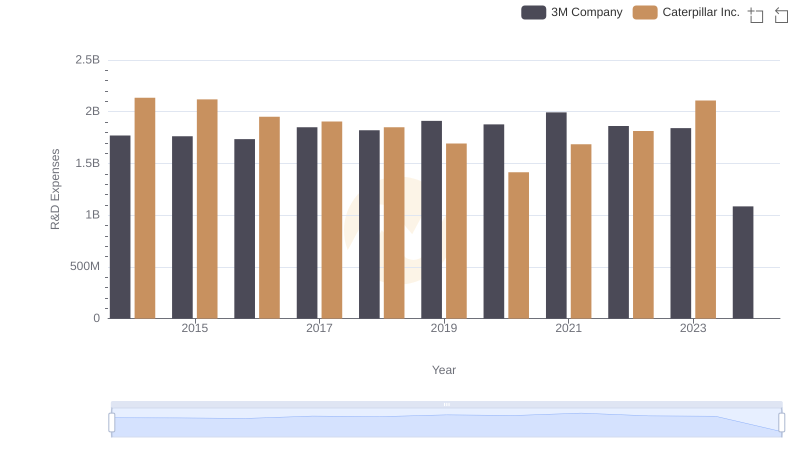
R&D Spending Showdown: Caterpillar Inc. vs 3M Company
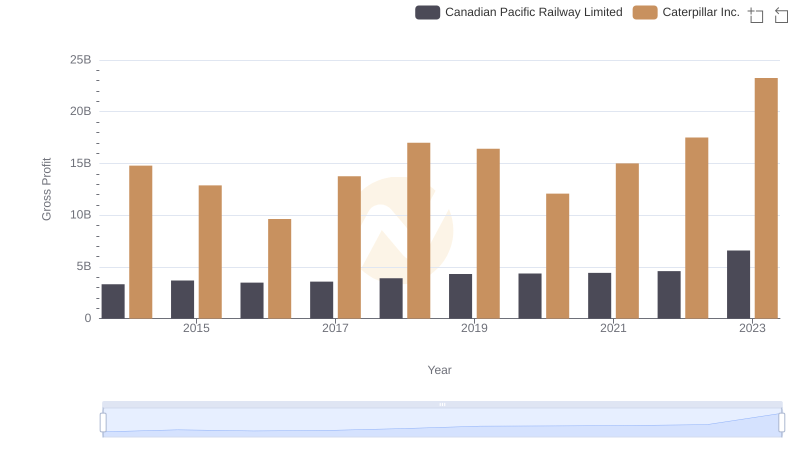
Gross Profit Comparison: Caterpillar Inc. and Canadian Pacific Railway Limited Trends